☐ ☐ ☒ ☐ ☐ Prologis, Inc.(Name of Person(s) Filing Proxy Statement, if other than the Registrant)Payment of Filing Fee (Check the appropriate box):☒ ☐ Fee computed on table below per Exchange Act Rules 14a-6(i)(1) and 0-11. (1)Title of each class of securities to which transaction applies:(2)Aggregate number of securities to which transaction applies:(3)Per unit price or other underlying value of transaction computed pursuant to Exchange Act Rule 0-11 (set forth the amount on which the filing fee is calculated and state how it was determined):(4)Proposed maximum aggregate value of transaction:(5)Total fee paid:☐materials.materials
Notice of of | ||||

AHEAD OF WHAT’S NEXT™
Prologis Proxy Statement
Notice of annual meeting of stockholders
Prologis Park Ontario, Ontario, California
Thursday, April 29, 2021
1:30 p.m., Pacific time
The date of this proxy statement is March 19, 2021
Notice of 2021 Annual Meetingof Stockholders
March 19, 2021
To our stockholders:
I invite you to attend the 20212023 annual meeting of stockholders of Prologis, Inc. at 1:30 p.m. on April 29, 2021. Due to the COVID-19 outbreak and to support the health and well-being of our stockholders, directors and employees, ourMay 4, 2023. Our annual meeting will be held in a virtual format only. You will not be able to attend the annual meeting physically.
Items of business. The following items of business will be conducted at our 20212023 annual meeting of stockholders:
| 1. | Elect eleven directors to our Board to serve until the next annual meeting of stockholders and until their successors are duly elected and qualified. | |
| 2. | Advisory vote to approve the company’s executive compensation for | |
| 3. | Advisory vote on the frequency of future advisory votes on the company’s executive compensation. |
| 4. | Ratify the appointment of KPMG LLP as our independent registered public accounting firm for the year | |
| 5. | Consider any other matters that may properly come before the meeting and at any adjournments or postponements of the meeting. |
| Record Date. If you were a holder of shares of our common stock at the close of business on March | How to Vote. You can vote your shares by proxy through the Internet, by telephone or by mail using the instructions on the proxy card or you can vote during the virtual annual meeting. Any proxy may be revoked in the manner described in the accompanying proxy statement at any time prior to its exercise at the annual meeting. | Meeting Attendance. To be admitted to the annual meeting at |
Proxy Materials. On or about March 19, 2021,24, 2023, we intend to distribute to our stockholders:
| (i) | Either in printed form by mail or electronically by email, a Notice of Annual Meeting and Internet Availability of Proxy Materials containing instructions on: (a) how to electronically access our |
| (ii) | If requested or required, printed proxy materials, which will include our |
On behalf of the Board of Directors,
EDWARD S. NEKRITZ Chief Legal Officer, General Counsel and Secretary |
Important Notice Regarding the Availability of Proxy Materials for the Annual Meeting of Stockholders to be held on
|


|
|
Table of Contents |

This proxy statement contains important information for you to consider when deciding how to vote on the matters brought before the Annual Meetingannual meeting of the Stockholders. Please read it carefully.
The following summary highlights information contained in this proxy statement. This summary does not contain all the information you should consider and you should read the entire proxy statement before voting. For more complete information regarding our 20202022 performance, please review our Annual Report on Form 10-K for the year ended December 31, 2020.2022. All company operational information in this proxy statement is for the year ended or as of December 31, 2020,2022, unless otherwise noted. See Appendix A for definitions and discussion of non-GAAP measures and reconciliations to GAAP measures and for additional detail regarding definitions of terms as generally explained in the proxy statement. References in this proxy statement to “we,” “us,” “our,” the “company,” and “Prologis” refer to Prologis, Inc. and its subsidiaries, unless the context otherwise requires.
Our Business HighlightsModel Delivers Long-Term Growth Across Cycles
Our business model delivers long-term growth and outperformance.
In 2020,2022, we stood resilient through the pandemic, outperforming both operationally anddelivered strong operational performance in the equity markets for yet another successful year.face of volatile macroeconomic circumstances, which continued our industry outperformance and earned record Promote income from our Strategic Capital business.


Financial Performance |
Strategic Capital is a Powerful Differentiator | |
|
|
Prologis Datteln Distribution Center 1, Datteln, Germany
| (1) |
|
|
|
The |
For further detail, please see “Compensation Discussion and Analysis.”
|
1
|
2020 2022 COMPENSATION HIGHLIGHTS
Compensation HighlightsProgram Improvements
OurIn response to stockholder feedback, we adopted various improvements to our compensation program, rewards for performance.including:


| Prologis Promote Program (PPP) | NEO Succession Planning | |
and regarding future Promote earning opportunities. |
to be commensurate with new executives’ tenure and |
PROLOGIS PROXY STATEMENT | MARCH 24, 2023 | 2 |
| PROXY SUMMARY |
Prologis Elizabeth Seaport, Elizabeth, New Jersey
2022 ENVIRONMENTAL, SOCIAL AND GOVERNANCE (ESG) HIGHLIGHTS
We Have a Long-Standing Record of ESG Leadership

By 2040 | #1 in ESG The top REIT ESG program by Institutional Investor 2022. | |
Commitment, announced in 2022, | ||
20 Consecutive Years
|
|
2020 Environmental Stewardship, Social Responsibility and Governance (ESG) Highlights
We have a long-standing commitment to ESG leadership.

|
| |
A leading REIT in corporate by Green |
Global sustainable companies
| |
Nanjing Airport Logistics Center, Nanjing, China
For further detail, please see “Board of Directors and Corporate |
|
3
|
Proposals Submitted to Vote at the 20212023 Annual Meeting
We are asking our stockholders of record on March 7, 2023, to vote on the following matters at our 2023 annual meeting of stockholders to be held on May 4, 2023. Please see the section entitled “Additional Information” for details on how to vote and the vote required to approve these matters.
|
Proposal | Board Recommendation | ||||
PROPOSAL 1:Election of Directors
|  |
| |||
PROPOSAL 2: Advisory Vote to Approve the Company’s Executive Compensation for
| |
| |||
PROPOSAL 3: Advisory Vote on the Frequency of Future Advisory Votes on the Company’s Executive Compensation At the annual meeting you will be asked to vote on whether future advisory votes on the company’s executive compensation should occur every year, every two years or every three years. The Board recommends voting “for” holding future advisory votes on the company’s executive compensation annually. |
| ||||
PROPOSAL
2023. | |
| |||

|
4
|
Board of Directors and Corporate Governance |
Corporate Governance
| Director Independence | ||
| Board Leadership Structure | ||
| Board Committees | ||
| Other Governance Matters | ||
|
5
|
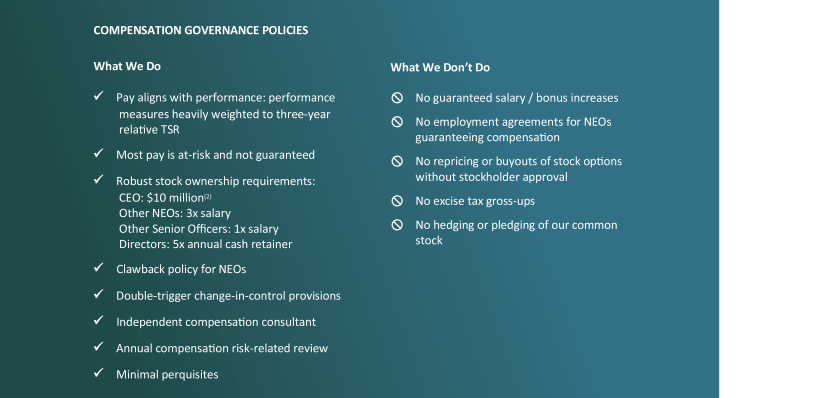
Prologis Corporate Governance Tear Sheet
| DIRECTOR COMPOSITION AND EVALUATION PROCESS | |||
· 91% of our Board is independent: All directors, other than our chairman, are independent.
· No related-party transactions.
· No hedging or pledging of our securities.
· All directors attended 75% or more of Board and Board committee meetings.(1)
· All directors are in compliance with our stock ownership guidelines (5x annual cash retainer). | ||||
| · Annual Board evaluation process involving Board, Board committee and individual director assessments: Administered by the chair of our Board Governance and Nomination Committee (the “Governance Committee”) and our lead independent director, with a third-party evaluation every other year.
· Age/tenure policy: 75 years maximum age limit and 15-year maximum tenure limit.
· Our mix of director tenure, skills and background provides a balance of experience and institutional knowledge with fresh perspectives.
· Three directors are female, and three are ethnically diverse. | |||
| BOARD LEADERSHIP · Lead independent director role with significant authority and responsibilities.
· Chairman and CEO policy gives Board flexibility to determine best candidate for the positions. | |||
| STRONG STOCKHOLDER RIGHTS · All directors elected annually since IPO. Irrevocably opted out of Maryland staggered board provisions in 2014. · Adopted proxy access with 3/3/20/20 market standard
· No stockholder rights plan.
·
· Stockholders can amend bylaws with majority vote (adopted in 1997). | |||
ESG GOVERNANCE · Formal board oversight over ESG efforts through Board Governance and Nomination Committee charter and updates to the full Board and other committees. · Energy, Sustainability, Mobility and ESG group reporting directly to C-suite (COO). · Accountability structure and ESG bonus metrics to incentivize success of ESG. | RISK GOVERNANCE · Financial risk oversight: Evidenced by A3/A credit ratings.(4) · Operational risk oversight: Annual enterprise level risk analyses with board; climate risk assessment platform; rigorous investment committee processes; local team property-level management. · Reputational risk oversight: Extensive employee learning and development platform requiring ethics, cybersecurity, diversity and other training. | |||
| (1) | Mr. Connor, who was appointed to the Board in October 2022, attended all Board meetings subsequent to his appointment. |
Our governance guidelines provide that directors will not be nominated or appointed to the Board if they are, or would be, 75 years or older or with 15 or more years of board tenure at the time of the election or appointment. Our board tenure policy applies to any director newly appointed or elected after the tenure policy was implemented (for purposes of calculating tenure limits, tenure of the directors incumbent as of the day of policy adoption started on the date of adoption). |
|
See “Additional Information” for further detail on proxy access. |
| (4) | Ratings by Moody’s/S&P. A securities rating is not a recommendation to buy, sell or hold securities and is subject to withdrawal at any time by the rating agency. |
|
6
|
Election of Directors (Proposal 1)
· The eleven nominees for election to the Board at the 2023 annual meeting, all proposed by the Board, are listed below in the section titled “Director Nominees,” along with brief biographies. · The Board has affirmatively determined that all of our director nominees, other than Hamid Moghadam, are independent directors in accordance with New York Stock Exchange (“NYSE”) rules, our governance guidelines and our bylaws.
·
· Information about each director nominee’s share ownership is presented below under “Security Ownership.”
The shares represented by the proxies received will be voted for the election of each of the eleven nominees named below, unless you indicate in the proxy that your vote should be cast against any or all of the director nominees or that you abstain from voting. Each nominee elected as a director will continue in office until his or her successor has been duly elected and qualified, or until the earliest of his or her resignation, retirement or death.
|

The Board unanimously recommends that the stockholders vote FOR the
election of each nominee.
|
7
|
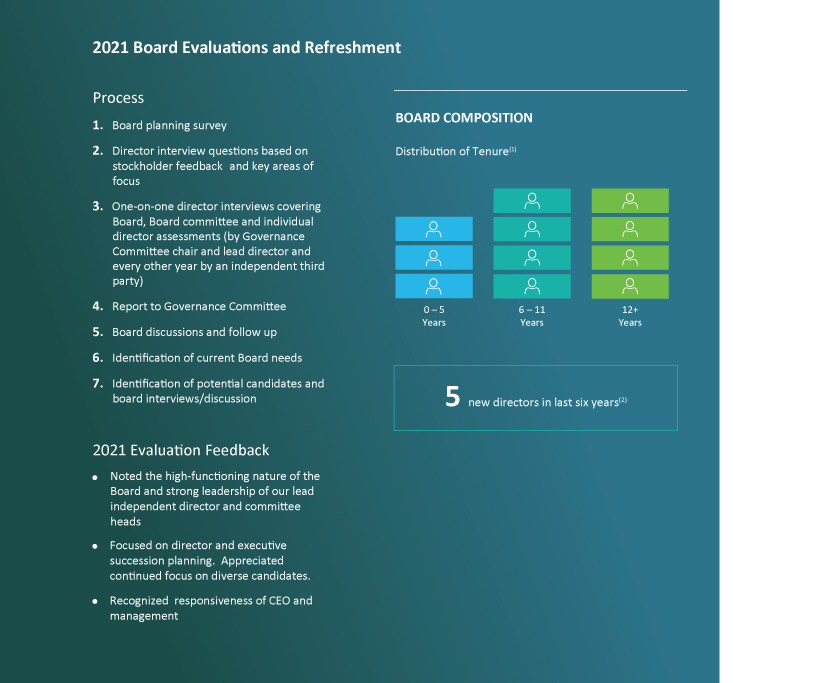
HOW IT WORKSBoard Evaluations and Process For Selecting Directors
Rigorous Board evaluation and refreshment process
Our annual Board evaluation process involves assessments at the Board, Board committee and individual director levels. Through this process, the Board determines who should be nominated to stand for election based on current company and Board needs. · Directors identify key skills and characteristics currently needed for the Board, as well as to provide information relating to Board composition and planning. · Director interview questions are prepared based on current areas of focus as well as feedback from our stockholder outreach efforts. · Annual one-on-one director interviews are conducted by our lead independent director and chair of the Governance Committee and, every other year, by an independent third party. · The results of the director interviews are aggregated by our lead independent director, Governance Committee chair, and if applicable, the independent third party, and reported to the Governance Committee and then to our full Board. Our Board follows up on items identified in the evaluation process. Our Governance Committee discusses Board succession and reviews potential candidates. This process is based on the results of annual board evaluations and takes place throughout the course of the year. · Our director candidate search process actively identifies and assesses a pool of potential candidates through a variety of sources, primarily through internal references. Although the committee may retain third parties to assist in identifying potential nominees, it prefers internal references by directors who understand the needs and dynamics of the Board with a particular focus on inclusion and diversity of ideas and background. · In 2021, we implemented a director/CEO recruitment diversity policy that requires the Governance Committee to consider (and any staffing agencies to recruit) ethnic and gender diverse candidates in formal director searches and recruitment for external CEO candidates. · Our governance guidelines also ensure regular board refreshment, providing that directors will not be nominated or appointed to the Board if they are, or would be, 75 years or older or with 15 or more years of board tenure at the time of the election or appointment. |
2023 Board evaluation feedback
Key feedback from our Board evaluation process:
· Noted the high-functioning nature of the Board and strong leadership of our lead independent director and committee heads. · Focused on executive succession planning. · Also focused on director succession planning and an orderly transition of key leadership positions and directors with institutional knowledge (coordinated with executive succession planning). · Recognized the strength of our CEO and management. · Determined that there were no concerns about Board independence or longer tenured directors. |
PROLOGIS PROXY STATEMENT | MARCH 24, 2023 | 8 |
| BOARD OF DIRECTORS AND CORPORATE GOVERNANCE |
Regular Board refreshment
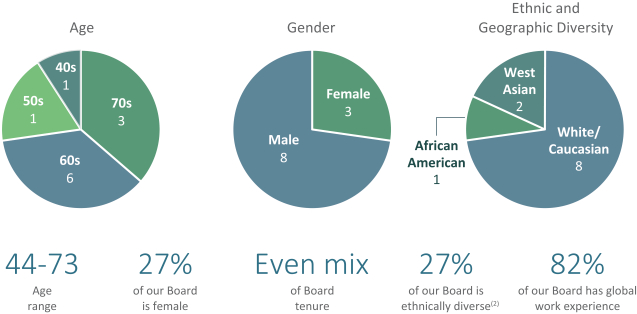
The Board is committed to regular refreshment to maintain an optimal balance of different perspectives, skills and backgrounds. We have onboarded six new directors in the past eight years, increasing the ethnic, gender and geographical diversity of the Board as well as breadth of experience. As a priority, the Board continues to be particularly focused on ethnic and gender diverse candidates who meet the current needs of the company.
The Board was completely refreshed and rebuilt at the time of the Merger(2) in 2011. The Merger essentially created a new company with a new operating and corporate platform. At that time, all directors underwent intensive review to determine which directors would best fit the newly created combined company. Each director selected in this rebuilding process was onboarded as a new director to the newly established company. These directors were required to perform in a new governance environment, with new structures, processes, committees, charters and guidelines.
We have continued to refresh the Board since the Merger. David O’Connor onboarded as a new director in 2015, Olivier Piani in 2017, Cristina Bita and Philip Hawkins in 2018, Avid Modjtabai in 2020 and James Connor in 2022. (In 2020, Mr. Hawkins took a position as executive chairman of a U.S. industrial real estate portfolio company and, as a result, decided to step down from our Board).
As a result of our regular board refreshment, the Board comprises an appropriate mix of tenures: four directors with up to six years of tenure, three directors with tenure between six and twelve years and four with over twelve years of tenure. This mix provides an even balance of experience and institutional knowledge with fresh perspectives.
The Board is focused on director succession planning as a priority. As directors approach the maximum age and/or tenure limit set forth in our director age and tenure policy, the Board proactively formulates a plan to transition key leadership positions and maintain the appropriate balance of institutional knowledge on the Board. As discussed in “Board Qualifications,” the Board continually assesses the current needs of the Board based on the strategic priorities of the company and actively recruits candidates with a focus on the diversity and skill set needs of the Board.
EVEN DISTRIBUTION OF DIRECTOR TENURE(1)(2)

6 | new directors in last eight years.(3) | |
| (1) | Directors nominated for election at our 2023 annual meeting of shareholders. |
| (2) | The entire Board was rebuilt in 2011 at the time of the merger (the “Merger”) between AMB Property Corporation and ProLogis (the “Trust”) and the tenure of the rebuilt Board started at that time. However, we include Mr. Moghadam, Ms. Kennard, Mr. Webb and Mr. Skelton in the 12+ year category as they were directors of the legal acquirer prior to the Merger. |
Includes Philip Hawkins, who joined our Board in 2018 and stepped down from our Board in 2020 to assume an executive chairman position at a U.S. industrial real estate company. |
|
|
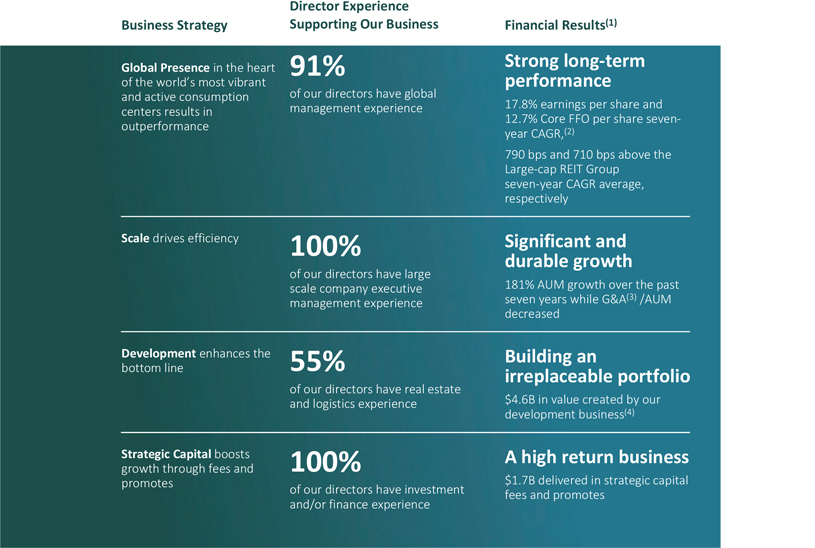
Director skills and experience support our business strategy
We have deep experience on our Board Evaluationscovering all components of our business model. The Board believes a balance of perspectives from other industries is critical to well-rounded oversight and Process for Selecting Directorsinsight into our customers’ perspectives.
Rigorous board evaluation and refreshment process
BUSINESS STRATEGY | DIRECTOR EXPERIENCE | FINANCIAL RESULTS(1) | ||||||
Global presencein the heart | 82% of our directors have global | Strong long-term performance 23.4% earnings per share CAGR and 11.7% Core FFO per share CAGR,(2) 1,566 bps and 428 bps above the Large-Cap REIT Group average | ||||||
Scaledrives efficiency | 100% of our directors have large | Significant and durable growth 306% AUM growth while G&A(3) as a percentage of AUMdecreased | ||||||
Developmentenhances the bottom line | 55% of our directors have real | Building an irreplaceable portfolio $7.9B in value created by our development business(4) | ||||||
Strategic Capitalboosts | 100% of our directors have investment | A high return business $4.1B delivered in strategic capital fees and Promotes | ||||||
Essentials, our platform offering logistics solutions, services and products, provides new revenue streams and strengthens customer relationships | 36% of our directors have experience with customer products, services and solutions | Additional earnings opportunities Total Essentials contracted sales grew by 150% from 2021 to 2022 | ||||||
| (1) |
|
| (2) |
|
|
|
|
|
|
|
|
Regular Board refreshment
|
|
|
|
|
|
|
Director Qualifications, Skills and Experience
Board composition and diversity
|
|
|
|
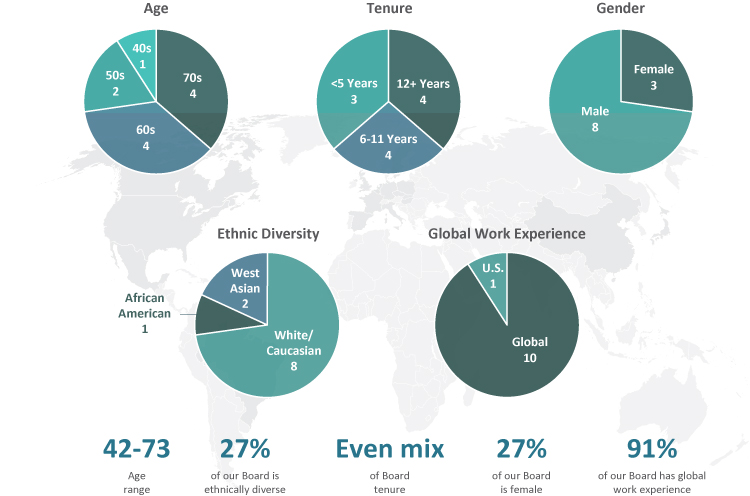
PROLOGIS BOARD DIVERSITY
|
|
Board Qualifications
Director skills and experience support our business strategy.
|
|
Our global platform outperformed the average of the |
| (3) | “G&A” are our general and administrative expenses. |
| (4) | Value created over our total expected investment through development and leasing activities based on current projections. Please see Appendix A for further detail regarding how we calculate “Value creation.” Development value creation is calculated across our owned and managed portfolio. |
|
|
Board composition and diversity
Our board diversity policy centers on our commitment to maintaining Board diversity in thought, background and experience—a mix of gender, ethnic background, geographic origin and professional experience that supports our business strategy and the current needs of the Board. As such, the Governance Committee focuses on identifying and nominating qualified and diverse director candidates with commensurate experience and background and each of our director nominees was chosen on this basis.
Our directors nominated for election at our 2023 annual meeting support this mix of diversity in gender, ethnicity and background (see the director demographics/skills matrix below). We are continually seeking new, diverse candidates to add to our Board—our current pipeline of potential candidates is comprised of mostly diverse individuals. Our board diversity policy (which is published on our website in our Governance Guidelines) requires that in any formal search for new directors, the Board will consider, and will instruct any third-party search firm to include, candidates from diverse backgrounds, including in its initial list both gender and racial/ethnic diverse director candidates.
In making its nominations, the Governance Committee also assesses each director nominee by key characteristics, including courage to voice opinions, integrity, experience, accountability, good judgment, supportiveness in working with others and willingness to commit the time needed to satisfy the requirements of Board and committee membership.
PROLOGIS BOARD DIVERSITY(1)
| (1) |
|
| (2) |
|
|
|
|
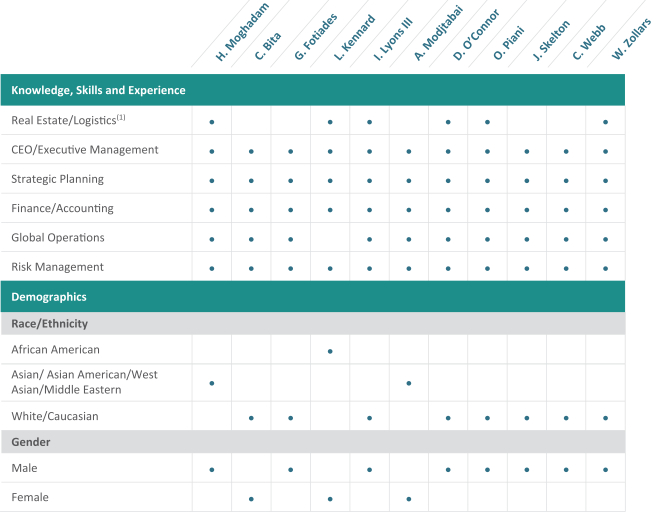
Director skills and experience support our business strategy
We have deep experience on our Board covering all components of our business model. The Board believes a balance of perspectives from other industries is critical to well-rounded oversight and insight into the perspectives of our customers covering a wide range of industries.
Along with the fundamental characteristics necessary for all directors, such as courage, wisdom and good judgment, below are qualifications of our Board identified in our Board evaluation process as important to support our current business strategy. These characteristics, coupled with diversity of thought and background, are critical to strong oversight and proven long-term results.
We also seek directors with skillsets that support our emerging areas of focus, including cybersecurity, data and energy. We consider whether candidates possess experience in such areas when evaluating potential directors.
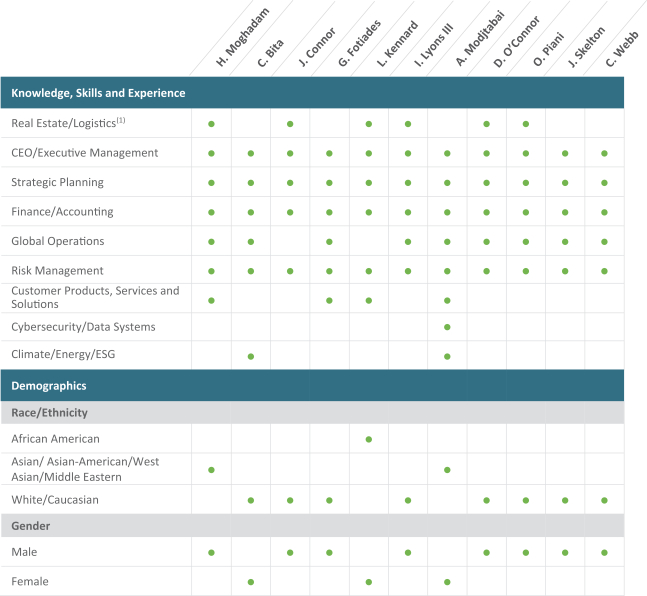
| (1) | Includes development, operations, real estate investments and fund management. |
PROLOGIS PROXY STATEMENT | MARCH 24, 2023 | 12 |
| BOARD OF DIRECTORS AND CORPORATE GOVERNANCE |
Director Nominees
Hamid R. Moghadam
  | Hamid R. Moghadam · Chairman of the Board since January 2000; Director since November 1997
· Board Committees: Executive
· Other public directorships: None |
Mr. Moghadam, 64,66, has been our Chief Executive Officerchief executive officer since the end of December 2012 and was our Co-Chief Executive Officerco-chief executive officer from June 2011 to December 2012. He is the co-founder of AMB Property Corporation and was AMB’s Chief Executive Officerchief executive officer from November 1997 (from the time of AMB’s initial public offering) to the Merger in June 2011 when AMB merged with the Trust.2011.
Other relevant qualifications.qualifications: Mr. Moghadam is on the board of the Stanford Management Company and formerly served as its chairman. He is a former trustee of Stanford University and previously served on the Executive Committee of the Board of Directors of the Urban Land Institute. Mr. Moghadam holds Bachelor’s and Master’s degrees in engineering from the Massachusetts Institute of Technology and a Master of Business Administration from the Graduate School of Business at Stanford University.
Irving F. Lyons IIISkills related to company opportunities and risks: Mr. Moghadam co-founded our company 40 years ago. He brings unique value as a founder who has built an unparalleled platform that has consistently outperformed both the REIT industry and S&P 500. Mr. Moghadam has unmatched experience running the largest publicly traded industrial REIT in the world with real estate operations and development across 19 countries. Mr. Moghadam built our Strategic Capital business (including two public companies and seven private vehicles), which is unrivaled in the REIT industry. His vision has further positioned the company for growth by creating an ecosystem of products, services and solutions for our customers via our Essentials platform. See page 55 for more information regarding Mr. Moghadam’s exceptional contributions to Prologis over the past four decades.
  | Irving F. Lyons III · Lead independent director since June 2011 (prior to the Merger served as a trustee of the Trust from September 2009 to June 2011 and from March 1996 to May 2006)
· Board Committees: Executive
· Other public directorships: Equinix, Inc. and Essex Property Trust, Inc. |
Mr. Lyons, 71,73, has been a principal with Lyons Asset Management, a private equity firm, since January 2005. In 2004, Mr. Lyons retired from the Trust where he served as chief investment officer from 1997 until his retirement. He joined the Trust in 1993 and served as president from 1999 to 2001 and vice chairman from 2001 to 2004. Mr. Lyons is a member of the boards of Equinix, Inc., a global data center operator, and Essex Property Trust, Inc., a real estate investment trust investingthat invests in apartment communities. Mr. Lyons previously served as chairman of the board of BRE Properties, Inc.
Other relevant qualifications.qualifications: Mr. Lyons joined the Trust when King & Lyons, an industrial real estate management and development company, was acquired by the Trust in 1993. Mr. Lyons had been the managing general partner in that firm since its inception in 1979 and was one of its principals at the time of the acquisition. Mr. Lyons holds a Master in Business Administration from Stanford University and a Bachelor of Science in industrial engineering and operations research from the University of California at Berkeley.
Skills related to company opportunities and risks: Mr. Lyons’ service as an executive in the logistics real estate industry, including as chief investment officer and president of the Trust, as a principal of a private equity firm and in leadership roles on the boards of other publicly traded REITs guide his oversight as our Board’s lead independent director.
|
|
Cristina G. Bita
  | Cristina G. Bita · Director since May 2018
· Board Committees: Audit
· Other public directorships: None |
Ms. Bita, 42,44, is a Vice Presidentvice president of Financefinance at Google and Business Finance Officerserves as the business finance officer for Google’s Devices and Services product area, Googleand Global Marketing organization and Google Sustainability. Sheorganizations. Ms. Bita leads global finance activities for consumer hardware, consumer paid services as well as for the company’s marketing investments globally. Ms. Bita has served in a number ofheld several finance leadership roles since joiningover the course of her 15+ year career at Google in 2006 across a range of business areas, including Global Partnershipsthat also included Sales and Business Development, Global Sales, and Consumer Products, Platforms and Platforms.Ecosystems, G&A, and Technical Infrastructure and Enterprise. She has also served as the chair of the Google Sustainability Board. Prior to Google, Ms. Bita spent six years with Siemens/Osram, where she held various positions at Siemens/Osram in the Business Unit Controllership and Corporate FP&A.&A groups.
Other relevant qualifications.qualifications: Ms. Bita holds a Master of Science in Finance from the Boston College Wallace E. Carroll School of Management and a Bachelor of Science in Business Administration (Accounting) from Salem State University. Ms. Bita is also a Certified Management Accountant (CMA).
George L. FotiadesSkills related to company opportunities and risks: Ms. Bita’s experience in innovation and technology gained from her tenure at Google supports our strategic initiatives to stay ahead of the evolution of the supply chain and our customers’ needs by integrating data systems and technology across both our core real estate and Essentials platforms. Ms. Bita also served as the chair of the Google Sustainability Board, which provides valuable insights in support of our ESG initiatives.
  | James B. Connor · Director since October 2022 · Board Committees: Executive · Other public directorships: EPR Properties and Healthpeak Properties, Inc. |
Mr. Connor, 64, was most recently chairman and chief executive officer of Duke Realty Corporation, a NYSE-listed company that specialized in modern, bulk warehouse and logistics facilities and was acquired by Prologis in October 2022. Mr. Connor joined Duke Realty in 1998 and served in several leadership positions before being named CEO in 2016. Before joining Duke Realty, Mr. Connor held numerous executive and brokerage positions with Cushman & Wakefield. Additionally, Mr. Connor is a member of the board of trustees of EPR Properties, a publicly traded REIT focused on real estate venues that facilitate out of home leisure and recreation experiences and the board of directors of Healthpeak Properties, Inc., a publicly traded REIT focused on real estate related to the healthcare industry.
Other relevant qualifications: Mr. Connor is a member of the Executive Board of Governors of the National Association of Real Estate Investment Trusts (Nareit). Mr. Connor holds a Bachelor of Business Administration degree with a minor in Real Estate Finance from Western Illinois University.
Skills related to company opportunities and risks: Mr. Connor brings over a quarter century of experience in the logistics REIT industry, including seven years as a public company CEO. His deep experience guides all aspects of our business related to the logistics real estate industry.
PROLOGIS PROXY STATEMENT | MARCH 24, 2023 | 14 |
| BOARD OF DIRECTORS AND CORPORATE GOVERNANCE |
 | George L. Fotiades · Director since June 2011 (prior to the Merger served as a trustee of the Trust from December 2001 to June 2011)
· Board Committees: Compensation (Chair)
· Other public directorships: AptarGroup, Inc. |
Mr. Fotiades, 67, was appointed President69, served as president and Chief Executive Officer*chief executive officer of Cantel Medical Corp., a provider of infection prevention and control products, from 2019 until his retirement in March 2019.2021. Mr. Fotiades was an operating partner at Five Arrows Capital Partners (Rothschild Merchant Banking) from April 2017 until March 2019. From April 2007 to April 2017, Mr. Fotiades was a partner, healthcare investments at Diamond Castle Holdings LLP, a private equity firm. Mr. Fotiades was chairman of Catalent Pharma Solutions, Inc., a provider of advanced technologies for pharmaceutical, biotechnology and consumer health companies, from June 2007 to February 2010. Mr. Fotiades is Chairmanchairman of the board of AptarGroup, Inc., a global dispensing systems company and is also a director of Cantel Medical Corp.company. He previously served on the boardboards of Cantel Medical Corp. and Alberto-Culver Company, a consumer products company specializing in hair and skin careskincare products.
Other relevant qualifications.qualifications: Mr. Fotiades was previously the president and chief operating officer of Cardinal Health, Inc. and also served as president and chief executive officer of Cardinal’s Pharmaceutical Technologies and Services segment. Mr. Fotiades also served as president of Warner-Lambert’s consumer healthcare business, as well as in other senior positions at Bristol-Myers Squibb, Wyeth, and Procter & Gamble. Mr. Fotiades holds a Master of Management from The Kellogg School of Management at Northwestern University and a Bachelor of Arts from Amherst College.
* Skills related to company opportunities and risks: Mr. Fotiades will no longer bebrings experience as a public company CEO who ran large scale global operations as well as years of Cantel Medical Corp. (or CEO in any other capacity) upon the closing of Steris Corporation’s acquisition of Cantel Medical Corp., expected to occurexperience in the second quarter of 2021. Should the Steris acquisition terminate or not close, private equity industry.Mr. Fotiades will nevertheless retireFotiades’ experience at various consumer products and services companies adds valuable insights as CEO of Cantel Medical Corp.
|
|
Lydia H. Kennardwe continue to grow our Essentials business.
  | Lydia H. Kennard · Director since August 2004
· Board Committees: Governance
· Other public directorships: Freeport-McMoRan Copper & Gold Inc., |
Ms. Kennard, 66,68, is the founder and chief executive officer of KDG Construction Consulting, a provider of project and construction management services, a principal of KDG Aviation, an aviation focused real estate operating and development company, the owner of KDG Holdings, Inc., parent of Quality Engineering Solutions, Inc., a pavement management analytics and construction inspection company, and a principal with 1031 N. Brand Boulevard, Glendale, LLC, aand 690 N. 2nd Street, Reno, LLC, both single-purpose real estate entity.entities. Ms. Kennard is a member of the boards of Freeport-McMoRan Copper & Gold Inc., a natural resource company, Healthpeak Properties, Inc., a healthcare real estate investment trust, and AECOM, an infrastructure consulting firm.firm, and Vulcan Materials Company, a leading producer of construction aggregates. Ms. Kennard was previously a member of the boards of URS Corporation, a provider of engineering, construction and technical services, and Intermec, Inc., an automated identification and data collection company.
Other relevant qualifications.qualifications: Ms. Kennard served as Chief Executive Officerchief executive officer of Los Angeles World Airports, a system of airports comprising Los Angeles International, Ontario International Airport, Palmdale Regional and Van Nuys General Aviation Airports from 1999 to 2003 and again from 2005 to 2007. From 1994 to 1999, she served as the system’s deputy executive for design and construction. Ms. Kennard holds a Juris Doctor degree from Harvard University, a Master’s degree in city planning from the Massachusetts Institute of Technology, and a Bachelor of Science in urban planning and management from Stanford University.
Avid ModjtabaiSkills related to company opportunities and risks: Ms. Kennard’s deep experience in the construction industry and urban planning supports our robust development platform. Ms. Kennard’s background as CEO of Los Angeles World Airports guides our efforts to grow our global logistics real estate business. As the owner of a construction analytics and solutions company, Ms. Kennard also provides experience in customer services and solutions.
PROLOGIS PROXY STATEMENT | MARCH 24, 2023 | 15 |
| BOARD OF DIRECTORS AND CORPORATE GOVERNANCE |
  | Avid Modjtabai · Director since February 2020
· Board Committees: Audit · Other public directorships: Avnet, Inc. |
Ms. Modjtabai, 59,61, served as the Senior Executive Vice Presidentsenior executive vice president and head of the Payments, Virtual Solutions and Innovation Group at Wells Fargo from 2016 to her retirement in March 2020. Prior to that, she served in various leadership roles at Wells Fargo, including Groupgroup head for Wells Fargo Consumer Lending from 2011 to 2016, Chief Information Officerchief information officer and head of Technology and Operations Group from 2008 to 2011, Chief Information Officerchief information officer and head of technology from 2007 to 2008, and Directordirector of Human Resourceshuman resources from 2005 to 2007. Ms. Modjtabai is a member of the board of Avnet, Inc., a global technology solutions provider.
Other relevant qualifications.qualifications: Ms. Modjtabai holds a Master in Business Administration in finance from Columbia University and a Bachelor of Science in industrial engineering from Stanford University.
|
|
David P. O’ConnorSkills related to company opportunities and risks: As the former chief information officer and head of technology of Wells Fargo, Ms. Modjtabai brings her experience overseeing core technology functions to our board. Ms. Modjtabai’s knowledge and skill in these areas supports the company’s own data and technology initiatives as well as our cybersecurity program. Ms. Modjtabai’s tenure as head of Payments, Virtual Solutions and Innovation at Wells Fargo brings additional customer solutions experience to our board.
  | David P. O’Connor · Director since January 2015
· Board Committees: Compensation
· Other public directorships: Regency Centers Corporation |
Mr. O’Connor, 56,58, is a private investor, managing partner of High Rise Capital Partners, LLC, a private real estate investment firm, and a non-executive co-chairman of HighBrook Investors LLC. He was the co-founder and senior managing partner of High Rise Capital Management LP, a real estate securities hedge fund manager that operated from 2001 to 2011. Mr. O’Connor is a member of the board of Regency Centers Corporation, a publicly traded real estate investment trust specializing in shopping centers. He previously served on the boardboards of Songbird Estates plc, the former majority owner of Canary Wharf in London, UK and Paramount Group, Inc., a publicly traded real estate investment and management company specializing in office buildings.
Other relevant qualifications.qualifications: Mr. O’Connor was previously a principal, co-portfolio manager and investment committee member of European Investors, Inc., a large dedicated real estate investment trust investor, from 1994 to 2000. Mr. O’Connor received a Master of Science in real estate from New York University and holds a Bachelor of Science degree from the Boston College Wallace E. Carroll School of Management.
Olivier PianiSkills related to company opportunities and risks: Mr. O’Connor brings extensive knowledge in real estate investment to our Board, which supports all aspects of our global real estate operations, Strategic Capital business and capital markets activity.
PROLOGIS PROXY STATEMENT | MARCH 24, 2023 | 16 |
| BOARD OF DIRECTORS AND CORPORATE GOVERNANCE |
  | Olivier Piani · Director since May 2017
· Board Committees: Audit
· Other public directorships: None |
Mr. Piani, 67,69, is the chief executive officer and founder of OP Conseils, a consulting company in real estate and finance that Mr. Piani started in January 2016. Mr. Piani is also a senior consultant with Ardian, a major European private equity group. From September 2008 to December 2015, Mr. Piani was chief executive officer of Allianz Real Estate, the real estate and asset management investment platform for the Allianz Group.
Other relevant qualifications.qualifications: From 1998 to 2008, Mr. Piani built the pan-European platform for GE Capital Real Estate spanning seven different countries. Prior to joining GE in 1998, Mr. Piani was chief executive officer of UIC-Sofal, a real estate bank. From 1982 to 1995, Mr. Piani held various leadership positions in the Paribas Group in Paris, New York and London. Mr. Piani is a graduate of Paris Ecole Superieure de Commerce de Paris and received a Master of Business Administration from Stanford University.
|
|
Jeffrey L. SkeltonSkills related to company opportunities and risks: Mr. Piani’s experience in real estate and finance gained through his career in private equity, asset management and banking supports our long-term investment strategy and our Strategic Capital business. Mr. Piani’s financial expertise and deep knowledge of the European real estate market guides our operations and growth in that region as well as our expansion into new markets.
  | Jeffrey L. Skelton · Director since November 1997
· Board Committees: Governance (Chair), Executive (Chair)
· Other public directorships: None |
Mr. Skelton, 71,73, retired in 2009 as president and chief executive officer of Symphony Asset Management, a subsidiary of Nuveen Investments, Inc., an investment management firm. After his retirement in 2009 and until 2013, Mr. Skelton was a co-founderco-founded and served as managing partner of Resultant Capital Partners, an investment management firm.
Other relevant qualifications.qualifications: Prior to founding Symphony Asset Management in 1994, Mr. Skelton was with Wells Fargo Nikko Investment Advisors from 1984 to 1993, where he served in a variety of capacities, including chief research officer, vice chairman, co-chief investment officer and chief executive officer of Wells Fargo Nikko Investment Advisors Limited in London. Previously, Mr. Skelton was also an assistant professor of finance at the University of California at Berkeley, Walter A. Haas School of Business. Mr. Skelton holds a Ph.D. in mathematical economics and finance and a Master of Business Administration from the University of Chicago.
Carl B. WebbSkills related to company opportunities and risks: Mr. Skelton’s significant leadership experience in the asset management industry supports our Strategic Capital business and forms a strong foundation for his oversight responsibilities as chair of our Governance and Executive Committees.
PROLOGIS PROXY STATEMENT | MARCH 24, 2023 | 17 |
| BOARD OF DIRECTORS AND CORPORATE GOVERNANCE |
  | Carl B. Webb · Director since August 2007
· Board Committees: Audit (Chair)
· Other public directorships: Hilltop Holdings Inc. |
Mr. Webb, 71,73, is currently a co-managing member of Ford Financial Fund II, L.P. and Ford Financial Fund III, L.P., private equity firms focusing on equity investments in financial services, a position he has held since February 2012 and March 2019, respectively. Mr. Webb has served as chairman of the Mechanics Bank board since April 2015. From June 2008 until December 2012, Mr. Webb was a senior partner of Ford Management, L.P. Mr. Webb was also the chief executive officer and a board member of Pacific Capital Bancorp and chairman of Santa Barbara Bank and Trust from August 2010 until December 2012. Mr. Webb has also served as a consultant to Hunter’s Glen/Ford, Ltd., a private investment partnership, since November 2002. Additionally, Mr. Webb is a member of the board of Hilltop Holdings Inc., a publicly traded financial services holding company.
Other relevant qualifications.qualifications: Mr. Webb previously served on the boards of Plum Creek Timber Company, M & F Worldwide Corp. and Triad Financial SM LLC, where he was co-chairman from July 2007 to October 2009 and served as interim president and chief executive officer from August 2005 to June 2007. Since 1983, Mr. Webb held executive positions at banking institutions, including Golden State Bancorp, Inc. and its subsidiary, California Federal Bank, FSB, First Madison Bank, FSB, First Gibraltar Bank, FSB and First National Bank at Lubbock. Mr. Webb holds a Bachelor of Business Administration from West Texas A&M University and a graduate banking degree from Southwestern Graduate School of Banking at Southern Methodist University.
Skills related to company opportunities and risks: Mr. Webb’s extensive finance experience gained over his career in private equity and banking supports our Strategic Capital business and his financial oversight role as chair of our Audit Committee.
|
18
|
William D. Zollars
 |
|
Mr. Zollars, 73, retired from YRC Worldwide, Inc., a global transportation service provider, in July 2011 where he served as chairman, president, and chief executive officer from 1999 until his retirement. He was president of Yellow Transportation, Inc. from 1996 to 1999. Mr. Zollars is a member of the board of Cerner Corporation, a supplier of healthcare information technology solutions, healthcare devices and related services. Mr. Zollars also serves on the U.S. Postal Service Board of Governors. He is a former director of CIGNA Corporation, a global health service organization.
Other relevant qualifications. Mr. Zollars was previously a senior vice president of Ryder Integrated Logistics, a division of Ryder System, Inc. and he spent 24 years in various executive positions, including eight years in international locations, at Eastman Kodak. Mr. Zollars holds a Bachelor of Arts in economics from the University of Minnesota.
|
|
We require that a majority of the Board be independent in accordance with NYSE rules. To determine whether a director is independent, the Board must affirmatively determine that there is no direct or indirect material relationship between the company and the director.
91% of the Board is independent.(1)
The Board has determined that all our directors, with the exception of our chairman, Mr. Moghadam, are independent.
|
The Board reached this determination after considering all relevant facts and circumstances, reviewing director questionnaires and considering transactions and relationships, if any, between us, our affiliates, our executive officers and their affiliates, and each of the directors, members of each of their immediate families and their affiliates.
Audit, Governance and Talent and Compensation Committees are 100% independent.
The Board has also determined that all members of the Audit, Governance and Talent and Compensation Committees of the Board are independent in accordance with NYSE and Securities and Exchange Commission (“SEC”) rules.
|
Our governance guidelines do not specify a leadership structure for the Board, allowing the Board the flexibility to choose the best option for the company as circumstances warrant. The Board believes that strong independent leadership ensures effective oversight over the company. Such independent oversight is maintained through:
| · | our lead independent director; |
| · | our independent directors; |
| · | the Audit, Governance and Talent and Compensation Committees, which are all comprised entirely of independent directors; |
| · | annual review of the Board leadership structure and effectiveness of oversight through the Board evaluation process; and |
| · | strong adherence to our governance guidelines. |
All of our independent directors have the ability to provide input for meeting agendas and are encouraged to raise topics for discussion by the Board. In addition, the Board and each Board committee has complete and open access to any member of management.
Each committee has the authority to retain independent legal, financial and other advisors as they deem appropriate without consulting or obtaining the approval of any member of management. The Board also holds regularly scheduled executive sessions of only independent directors in order to promote free and open discussion among the independent directors.
|
|
Chairman and CEO assessment
Our chairman and CEO and our lead independent director act together in a system of checks and balances, providing both strong oversight and operational insight.
Our CEO, Mr. Moghadam, serves as chairman of the Board. The lead independent director role is focused on ensuring independent oversight of the company. Mr. Moghadam’s roles as both CEO and chairman enable him to act as a bridge between management and the Board, ensuring that the Board understands our business when making its decisions.
| (1) | Directors nominated for election at our 2023 annual meeting of shareholders. |
PROLOGIS PROXY STATEMENT | MARCH 24, 2023 | 19 |
| BOARD OF DIRECTORS AND CORPORATE GOVERNANCE |
Mr. Moghadam has the breadth of experience to execute our unique business plan and to provide special insights to the Board.
Very few have experience running a public company with extensive global real estate operations and substantial strategic capitalStrategic Capital and development businesses. Mr. Moghadam co-founded the company and has served on the Board since the company’s initial public offering in November 1997. As one of our founders, Mr. Moghadam has extensive knowledge and expertise in the real estate and REIT industries, as well as history and knowledge of our company.
Considering all of these factors, the Board believes that a structure that combines the roles of CEO and chairman, along with an independent lead director, independent chairs for each of the Board committees and independent non-employee directors, provides the best leadership for the company at this time and places the company in a competitive position to provide long-term value to our stockholders. Through its annual board evaluation process (led by an independent third-party evaluator every other year), the board regularly assesses this structure and determines whether it continues to be in the best interests of the company and its stockholders.
Lead independent director
If the offices of chairman and CEO are held by the same person or if the chairman is otherwise not independent, the independent members of the Board will annually elect an independent director to serve in a lead capacity. The lead independent director is generally expected to serve for more than one year. Mr. Lyons has been selected as the lead independent director by our Governance Committee and the independent members of our Board and has served in that capacity for nearly ten years.Board.
The lead independent director coordinates the activities of the other independent directors and performs other duties and responsibilities as determined by the Board.
The specific responsibilities of the lead independent director are currently as follows:
Executive Sessions/ Committee Meetings | · Presides at all meetings of the Board at which the chairman is not present, including executive sessions of the independent directors (generally held at every regular Board meeting)
· Attends meetings of the various Board committees regularly
| ||
Meetings of Independent Directors | · Has the authority to call meetings of the independent directors and set the agenda | ||
Board Evaluations | · Oversees, with the chair of the Governance Committee and, when applicable, an independent | ||
and CEO |
| ||
| · Serves as liaison between the independent directors and the chairman
· Meets regularly between Board meetings with the chairman and CEO | ||
Board Processes and Information | · Ensures the quality, quantity, appropriateness and timeliness of information provided to the Board and provides input to create meeting agendas
· Ensures that feedback is properly communicated to the Board and chairman
· Ensures the institution of proper Board processes, including the number, frequency and scheduling of Board meetings and sufficient time for discussion of all agenda items | ||
Communications with Stockholders | · Responds to stockholder inquiries and communicates with stockholders when appropriate | ||
|
|
Pursuant to the Maryland General Corporation Law and our bylaws, our business, property and affairs are managed under the direction of the Board. Members of the Board are kept informed of our business through our executive management team.
The four standing committees of the Board are: Audit, Governance, Talent and Compensation (the “Compensation Committee”) and Executive Committee (the “Executive Committee”). The Board has determined that each member of the Audit, Governance and Talent and Compensation Committees is an independent director in accordance with NYSE and SEC rules.
The current membership information for our Board committees is presented below.
Each committee has a charter which generally states the purpose of the committee and outlines the committee’s structure and responsibilities. The committees, other than the Executive Committee, must review their charter on an annual basis.
PROLOGIS BOARD COMMITTEES
Audit Committee
Members: Carl Webb (Chair), Cristina Bita, Avid Modjtabai and Olivier Piani
Number of Meetings in 2020: 9
| Audit Committee |

Members: Carl Webb (Chair) Cristina Bita Avid Modjtabai Olivier Piani | Meetings in 2022: 9 | Independence: The Board has determined that all members of the Audit Committee are independent in accordance with NYSE and SEC rules. | ||||||
Role and Responsibilities:
| · | Oversees the financial accounting and reporting processes of the |
| · |
|
| · |
|
| · |
|
| · | Oversees company process for developing data systems and disclosures related to emerging climate disclosure regimes. |
| · | All committee members are designated by the Board as “audit committee financial experts” in accordance with SEC regulations and meet the independence, experience and financial literacy requirements of the NYSE and Section 10A of the Securities Exchange Act of 1934, as |
| Talent and Compensation Committee |

Members: George Fotiades (Chair) David O’Connor William Zollars | Meetings in 2022: 5 | Independence: The Board has determined that all members of the Talent and Compensation Committee are independent in accordance with NYSE and Securities and Exchange Commission rules. | ||||||
Role and Compensation Committee
Members: George Fotiades (Chair), David O’Connor and William Zollars
Number of Meetings in 2020: 6Responsibilities:
| · |
|
PROLOGIS PROXY STATEMENT | MARCH 24, 2023 | 21 |
| BOARD OF DIRECTORS AND CORPORATE GOVERNANCE |
| · | Approves and evaluates our director and officer compensation plans, policies and |
| · |
|
| · |
|
| · |
|
|
|
|
| · |
|
| · |
|
| · |
|
| · |
|
| · |
|
| · |
|
| Board Governance and Nomination Committee |

Members: Jeffrey Skelton (Chair) Lydia Kennard William Zollars | Meetings in 2022: 3 | Independence: The Board has determined that all members of the Governance Committee are independent in accordance with NYSE and SEC rules. | ||||||
Role and Nomination Committee
Members: Jeffrey Skelton (Chair), Lydia Kennard and William Zollars
Number of Meetings in 2020: 3Responsibilities:
| · |
|
| · |
|
| · |
|
| · |
|
| · |
|
| · |
|
| · |
|
| · |
|
Executive Committee
| · | Reviews company political lobbying activity and spending. |
Members: Jeffrey Skelton (Chair), Irving Lyons III and Hamid Moghadam
Number of Meetings in 2020: 0
PROLOGIS PROXY STATEMENT | MARCH 24, 2023 | 22 |
| BOARD OF DIRECTORS AND CORPORATE GOVERNANCE |
| Executive Committee |

Members: Jeffrey Skelton (Chair) James Connor Irving Lyons III Hamid Moghadam | Meetings in 2022: None | Independence: The Board has determined that James Connor, Jeffrey Skelton and Irving Lyons III are independent in accordance with NYSE and SEC rules. | ||||||
Role and Responsibilities:
| · | Acts only if action by the Board is required, the Board is unavailable, and the matter is |
| · |
|
impose. |
|
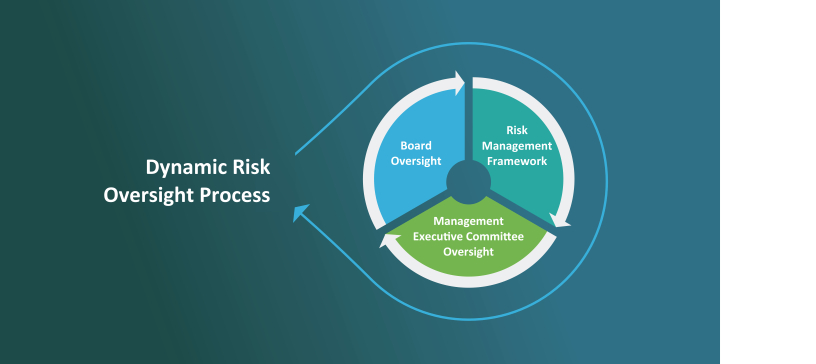
Board’s role in risk oversight
Risk awareness is embedded throughout our operations, underpinned by an integrated framework for identifying, assessing and managing risk.
The Board has the primary responsibility for overseeing risk management of the company. Oversight for certain specific risks falls under the responsibilities of our Board committees.
| · | The Audit Committee focuses on financial and cybersecurity risks relating to the |
| · | The Talent and Compensation Committee focuses on risks relating to human capital management, talent retention and remuneration of our officers and |
| · | The Governance Committee focuses on reputational, corporate governance and ESG |
These committees regularly advise the full Board of their risk oversight activities.
Critical components of our risk oversight framework include regular communication among the Board, our management executive committee and our risk management infrastructure to identify, assess and manage risk.
Identifying, managing and assessing risks
|
|
Identifying, Managing and Assessing Risks
Our risk oversight framework includes:
| · |
|
| · |
|
| · |
|
| · |
|
| · |
|
| · |
|
PROLOGIS PROXY STATEMENT | MARCH 24, 2023 | 23 |
Cybersecurity
| BOARD OF DIRECTORS AND CORPORATE GOVERNANCE |
Climate risk
We assess natural hazard and climate risk across our portfolio. Our Chief Technology Officerrisk management team works to ensure we have sufficient insurance coverage and protection for our buildings. We also partner with a global reinsurance company to evaluate future climate scenarios and determine which actions we should take. This evaluation is based on underwriting data, a significant improvement over the traditional catastrophe modeling and flood zone data used by many other organizations. Based on this evaluation, we take a range of actions which can include improving the physical resilience of our buildings, reviewing and improving disaster response plans, and other measures. Because of our long-term planning, resilience measures and diverse portfolio footprint, we believe our climate risk is well-managed.
Cybersecurity
Our chief technology officer and our Vice Presidentvice president of IT Governancegovernance oversee our information security program. They report to the audit committee/board at least annually and also conduct annual information security compliance training. The Prologis Information Security Policy is governed by the NIST Cybersecurity Framework (CSF) and includes mandatory annual training for all employees. Prologis’ cybersecurity posture is reviewed and benchmarked against its peers through regular participation in a third-party security benchmarking survey. Our IT infrastructure is externally audited as part of our Sarbanes Oxley audit process and our controls include information security standards. Also, we maintain standalone cybersecurity insurance. To our knowledge, we have not experienced a material breach in information security.
CEO and management succession planning
The Board is responsible for ensuring that we have a high-performing management team in place. The Board, with the assistance of the Talent and Compensation Committee, regularly conducts a detailed review of management development and succession planning activities to ensure that top management positions, including the CEO position, can be filled without undue interruption.
Our succession planning process is two-tiered to ensure orderly succession. One tier contemplates succession planning in the case of an emergency during which one or more members of our current management are unable to perform their duties. The second tier involves long-term planning to identify and develop talent with potential to step in as our future management team. As part of our longer termlonger-term succession planning, we made changes in 2019 and 2020 to our organizational architecture to prepare the company for the next chapter in its evolution. Executive roles were reorganized to drive our platform initiatives focusing on customer centricity and extracting value beyond our real estate while allowing for growth opportunities for the next generation of potential leaders. As an example, Mr. Olinger was instrumental in positioning his successor, Mr. Arndt, with key global leadership responsibilities to prepare Mr. Arndt for the role of CFO after Mr. Olinger’s retirement. Mr. Arndt assumed the position of CFO on April 1, 2022. Likewise, Mr. Reilly helped to prepare Mr. Letter for the role of president, which Mr. Letter assumed on January 1, 2023, through a variety of leadership roles at the company related to capital deployment and global operations. Also see “Compensation Committee Rationale: NEO Succession Planning” for a discussion of the committee’s approach regarding successor NEO compensation.
Communications with directors
We appreciate your input. Our lead independent director (or any of our other directors) are accessible to our stockholders and other interested parties for engagement as appropriate. You can communicate with any of the directors, individually or as a group, by writing to them in care of Edward S. Nekritz, Secretary, Prologis, Inc., Pier 1, Bay 1, San Francisco, California 94111. Each communication intended for the Board and received by the secretary that is related to the operation of the company and is not otherwise commercial in nature will be forwarded to the specified party following its clearance through normal security procedures. The directors will be advised of any communications that were excluded through normal security procedures as appropriate and they will be made available to any director who wishes to review them.
|
|
Director attendance
The Board held foureight meetings in 2020,2022, including telephonic meetings, and all of the directors attended 75% or more of the aggregate number of Board and applicable committee meetings on which he or she served during 20202022 (held during the periods they served). Each director standing for election in 20212023 is expected to attend the annual meeting of stockholders, either virtually or telephonically, absent cause. All of our directors attended the annual meeting last year, virtually or telephonically.telephonically, other than Mr. Connor who was appointed to the Board after the 2022 annual meeting.
Director compensation
Please see “Director Compensation” and the table titled “Director Compensation for Fiscal Year 2020.2022.”
Stock ownership guidelines and prohibition on hedging/pledging
Our directors must comply with our stock ownership guidelines which require the director to maintain an ownership level in our common stock equal to five times the annual cash retainer (a total of $600,000 as of December 31, 2020)2022). Shares included as owned by directors for purposes of the guidelines include common stock owned, vested or unvested equity awards (restricted stock, restricted stock units, shares and share units deferred under the terms of the Director Deferred Fee Plan or the applicable non-qualified deferred compensation plan, deferred share units and dividend equivalent units) and operating partnership or other partnership units exchangeable or redeemable for common stock. Until such time as the ownership thresholds are met, we will require directors to retain and hold 50% of any net shares of our common stock issued to our directors under our equity compensation plans.
Additionally, our insider trading policy prohibits our directors and employees from hedging the economic risk of ownership of our common stock and from pledging shares of our common stock.
All of our directors and executive officers are currently in compliance with the stock ownership guidelines and the prohibition on hedging and pledging our common stock.
Independent compensation consultant
The Talent and Compensation Committee directly engaged an outside compensation consulting firm, Frederic W. Cook & Co., Inc. (“FW Cook”)Pay Governance, to assist the committee in assessing our compensation programs for our Board, our CEO and other members of executive management. FW Cook reported directly to the Compensation Committee. FW Cook received no compensation from the company other than for its work in advising the Compensation Committee and maintained no other economic relationships with the company. FW Cook interacted directly with members of our management only on matters under the Compensation Committee’s oversight.
FW Cook conducted a comprehensive competitive review of the compensation program for our executive officers and our non-employee directors in April 2020, which was used by the Compensation Committee to assist it in making compensation recommendations to the Board. Our CEO makes separate recommendations to the Compensation Committee concerning the form and amount of the compensation of our executive officers (excluding his own compensation). FW Cook has also assisted the Compensation Committee in evaluating the design of certain outperformance compensation plans first implemented in 2012.
The Compensation Committee considered the independence of FW Cook in light of the rules regarding compensation committee advisor independence mandated under the Dodd-Frank Wall Street Reform and Consumer Protection Act (“Dodd-Frank Act”). The Compensation Committee reviewed factors, facts and circumstances regarding compensation consultant independence, including a letter from FW Cook addressing FW Cook’s and their consulting team’s independent status with respect to the following factors: (i) other services provided to us by FW Cook; (ii) fees we pay to FW Cook as a
|
|
percentage of their total revenues; (iii) FW Cook’s policies and procedures that are designed to prevent conflicts of interest; (iv) any business or personal relationship between FW Cook or members of their consulting team that serves the Compensation Committee and a member of the Compensation Committee; (v) any shares of our stock owned by FW Cook or members of their consulting team that serves the Compensation Committee; and (vi) any business or personal relationships between our executive officers and FW Cook or members of their consulting team that serves the Compensation Committee. After discussing these factors, facts and circumstances, the Compensation Committee affirmed the independent status of FW Cook and concluded that there are no conflicts of interest with respect to FW Cook.
At the end of 2020, the Compensation Committee engaged another compensation consulting firm, Pay Governance, switching our compensation consulting firms as a good compensation governance practice. Pay Governance reports directly to the Talent and Compensation Committee. Pay Governance receives no compensation from the company other than for its work in advising the Talent and Compensation Committee and maintains no other economic relationships with the company. Pay Governance interacts directly with members of our management only on matters under the Talent and Compensation Committee’s oversight.
Pay Governance conducted a comprehensive competitive review of the compensation program for our non-employee directors in May 2022 and executive officers in December 2022, which was used by the Talent and Compensation Committee to assist it in making compensation recommendations to the Board. Our CEO makes separate recommendations to the Talent and Compensation Committee concerning the form and amount of the compensation of our executive officers (excluding his own compensation).
The Talent and Compensation Committee considered the independence of Pay Governance in light of the rules regarding compensation committee advisor independence mandated under the Dodd-Frank Act. The Talent and Compensation Committee reviewed factors, facts and circumstances regarding compensation consultant independence, including a letter from Pay Governance addressing Pay Governance and their consulting team’s independent status with respect to the following factors: (i) other services provided to us by Pay Governance; (ii) fees we pay to Pay Governance as a percentage of their total revenues; (iii) Pay Governance’s policies and procedures that are designed to prevent conflicts of interest;
PROLOGIS PROXY STATEMENT | MARCH 24, 2023 | 25 |
| BOARD OF DIRECTORS AND CORPORATE GOVERNANCE |
(iv) any business or personal relationship between Pay Governance or members of their consulting team that serves the Talent and Compensation Committee and a member of the Talent and Compensation Committee; (v) any shares of our stock owned by Pay Governance or members of their consulting team that serves the Talent and Compensation Committee; and (vi) any business or personal relationships between our executive officers and Pay Governance or members of their consulting team that serves the Talent and Compensation Committee. After discussing these factors, facts and circumstances, the Talent Compensation Committee affirmed the independent status of Pay Governance and concluded that there are no conflicts of interest with respect to Pay Governance.
Talent and Compensation Committee interlocks and insider participation
No member of the Talent and Compensation Committee (i) was, during the year ended December 31, 2020,2022, or had previously been, an officer or employee of the company or (ii) had any material interest in a transaction with the company or a business relationship with, or any indebtedness to, the company. No interlocking relationships existed during the year ended December 31, 2020,2022, between any member of the Board or the Talent and Compensation Committee and an executive officer of the company.
Code of Ethics and Business Conduct and Governance Guidelines
The Board has adopted a code of ethics and business conduct that applies to all employees and directors. The Board has formalized policies, procedures and standards of corporate governance that are reflected in our Governance Guidelines.
Our Code of Ethics and Business Conduct outlines in great detail the key principles of ethical conduct expected of our employees, officers and directors, including matters related to conflicts of interest, use of company resources, fair dealing, and financial reporting and disclosure. The code establishes formal procedures for reporting illegal or unethical behavior to the company’s internal ethics committee. These procedures permit employees to report any concerns, including concerns about the company’s accounting, internal accounting controls or auditing matters, on a confidential or anonymous basis if desired. Employees may contact the ethics committee by email, in writing, by web-based report or by calling a toll-free telephone number. Any significant concerns are reported to the Audit Committee in accordance with the code.
|
|
Simultaneous Board service
Our director overboarding policy in our governance guidelines requirerequires that, if a director serves on three or more public company boards simultaneously, including our Board, a determination is made by our Board as to whether such simultaneous service impairs the ability of such member to effectively serve the company. Messrs. Fotiades andMr. Lyons and Ms. Kennard currently serve on at least three public company boards, including our Board. In each case, our Board has determined that such simultaneous board service does not impair the Board member’s ability to be an effective member of our Board.
Mr. Fotiades is the chief executive officer and a director of Cantel Medical Corp. He has advised us that he will no longer be CEO of Cantel Medical Corp. (or CEO in any other capacity) upon the closing of Steris Corporation’s acquisition of Cantel Medical Corp., expected to occur in the second quarter of 2021. Should the Steris acquisition terminate or not close, Mr. Fotiades will nevertheless retire as CEO of Cantel Medical Corp.
Certain relationships and related party transactions
We do not have any related party transactions to report under relevant SEC rules and regulations. According to our Articles of Incorporation, the Board may authorize any agreement or other transaction with any party even though one or more of our directors or officers may be a party to such an agreement or is an officer, director, stockholder, member or partner of the other party if: (i) the existence of the relationship is disclosed or known to the Board, and the contract or transaction is authorized, approved or ratified by the affirmative vote of not less than a majority of the disinterested directors, even if they constitute less than a quorum of the Board; (ii) the existence is disclosed to the stockholders entitled to vote, and the contract or transaction is authorized, approved or ratified by a majority of the votes cast by the stockholders entitled to vote (excluding shares owned by any interested director or officer or the organization in which such person is a director or has a material financial interest); or (iii) the contract or transaction is fair and reasonable to the company.
PROLOGIS PROXY STATEMENT | MARCH 24, 2023 | 26 |
| BOARD OF DIRECTORS AND CORPORATE GOVERNANCE |
We recognize that transactions between us and related parties can present potential or actual conflicts of interest and create the appearance that our decisions are based on considerations other than the company’s best interests and the best interests of our stockholders. Related parties may include our directors, executives, significant stockholders and immediate family members and affiliates of such persons.
Accordingly, several provisions of our code of ethics and business conduct are intended to help us avoid the conflicts and other issues that may arise in transactions between us and related parties, prescribing that:
| · |
|
| · |
|
| · |
|
| · |
|
These provisions of our code of ethics and business conduct may be amended, modified or waived by the Board or the Governance Committee, subject to the disclosure requirements and other provisions of the rules and regulations of the SEC and the NYSE.
No waivers of our code of ethics and business conduct were granted in 2020.2022.
Although we do not have detailed written procedures concerning the waiver of the application of our code of ethics and business conduct or the review and approval of transactions with directors or their affiliates, our directors would consider all relevant facts and circumstances in considering any such waiver or review and approval.
|
|
Biographies of our executive officers as of March 2021,2023, other than Mr. Moghadam, are presented below. Information for Mr. Moghadam is included above under “Board of Directors and Corporate Governance.” All ofMessrs. Moghadam, Arndt, Reilly, Anderson and Nekritz, along with Thomas S. Olinger, our executive officersformer CFO, are treated as named executive officers (each an “NEO”) for purposes of this proxy statement.
Thomas S. Olinger:Timothy D. Arndt
Chief Financial Officer
Years at Prologis: 18
Mr. Olinger, 54,Arndt, 50, has been our chief financial officer since May 2012April 2022 and was our chief integration officertreasurer from June 2011December 2013 to May 2012.April 2022. Prior thereto, Mr. Olinger wasArndt held various positions with the chief financial officercompany since joining AMB Property Corporation (“AMB”), Prologis’ predecessor company, in 2004, including as head of AMB from March 2007 to June 2011.corporate planning and as a part of the Company’s global deployment team. Prior to joining AMB, in February 2007, Mr. Olinger was the vice president and corporate controller at Oracle Corporation, an enterprise software company and provider of computer hardware products and services. Prior to his employment with Oracle, Mr. Olinger was an accountant and partner at Arthur Andersen LLP, where he served as the lead partner on our account from 1999 to 2002. Since January 2011, Mr. Olinger has served as a director of American Assets Trust, aworked in real estate investment trust investingstrategy at Gap Inc. and in office, retail and residential properties.debt capital markets at Forest City Enterprises. Mr. Olinger holds a Bachelor of Science in finance from the Kelley School of Business at Indiana University.
Eugene F. Reilly: Chief Investment Officer
Mr. Reilly, 59, has been our chief investment officer since March 2019. Mr. Reilly was our CEO, the Americas, from June 2011 until March 2019, and he served as president, the Americas, as well as a number of other executive positions, at AMB from October 2003 until the Merger in June 2011. Mr. Reilly serves on the technical committee of FIBRA Prologis, a publicly traded Mexican REIT that is sponsored and managed by the company. Prior to joining AMB in October 2003, Mr. Reilly was chief investment officer of Cabot Properties, Inc., a private equity industrial real estate firm of which he was also a founding partner. From August 2009 until December 2015, Mr. Reilly served as a director of Strategic Hotels and Resorts, an owner and asset manager of high-end hotels and resorts. Mr. Reilly holds an A.B. degree in economics from Harvard College.
Edward S. Nekritz: Chief Legal Officer, General Counsel and Secretary
Mr. Nekritz, 55, has been our chief legal officer, general counsel and secretary since the Merger in June 2011. Mr. Nekritz was general counsel of the Trust from December 1998 to June 2011 and secretary of the Trust from March 1999 to June 2011. Mr. Nekritz serves on the technical committee of FIBRA Prologis. Prior to joining the Trust in September 1995, Mr. Nekritz was an attorney with Mayer, Brown & Platt (now Mayer Brown LLP). Mr. Nekritz holds a Juris Doctor degreeArndt received his BBA from the University of Chicago Law SchoolToledo and an A.B. degree in governmentMBA from Harvard College.Cleveland State University. In addition, he completed the Stanford Executive Program at the Stanford Graduate School of Business.
Gary E. Anderson:Anderson
Chief Operating Officer
Years at Prologis: 28
Mr. Anderson, 55,57, has been our chief operating officer since March 2019. Mr. Anderson was our CEO, Europe and Asia, from June 2011 until March 2019. Mr. Anderson held various positions with the Trust from August 1994 to June 2011, including head of the Trust’s global fund business from March 2009 to June 2011 and president of the Trust’s European operations from November 2006 to March 2009. Prior to joining the Trust, Mr. Anderson held various positions with Security Capital Group Incorporated, a diversified real estate investment company. Mr. Anderson holds a Master of Business Administration in finance and real estate from the Anderson Graduate School of Management at the University of California at Los Angeles and a Bachelor of Arts in marketing from Washington State University.
Eugene F. Reilly
Vice Chairman
Years at Prologis: 19
Mr. Reilly, 62, has been our vice chairman since January 2023. Mr. Reilly was our chief investment officer from March 2019 to December 2022. He was our CEO, the Americas, from June 2011 until March 2019, and he served as president, the Americas, as well as a number of other executive positions, at AMB from October 2003 until the Merger in June 2011. Mr. Reilly serves on the technical committee of FIBRA Prologis, a publicly traded Mexican REIT that is sponsored and managed by the company. Prior to joining AMB in October 2003, Mr. Reilly was chief investment officer of Cabot Properties, Inc., a private equity industrial real estate firm of which he was also a founding partner. From August 2009 until December 2015, Mr. Reilly served as a director of Strategic Hotels and Resorts, an owner and asset manager of high-end hotels and resorts. Mr. Reilly holds an A.B. degree in economics from Harvard College.
Daniel S. Letter
President
Years at Prologis: 18
Mr. Letter, 46, has been our president since January 2023. Mr. Letter served as global head of capital deployment from January 2021 until January 2023, where he was responsible for the company’s Investment Committee, deployment forecasting, deployment pipeline management and multi-market portfolio acquisitions and dispositions. Prior thereto, Mr. Letter held various positions with the company since joining in 2004, including as president, central region. Mr. Letter holds a Bachelor of Science in civil engineering from Marquette University.
PROLOGIS PROXY STATEMENT | MARCH 24, 2023 | 28 |
| EXECUTIVE OFFICERS |
Edward S. Nekritz
Chief Legal Officer, General Counsel and Secretary
Years at Prologis: 27
Mr. Nekritz, 57, has been our chief legal officer, general counsel and secretary since the Merger in June 2011. Mr. Nekritz was general counsel of the Trust from December 1998 to June 2011 and secretary of the Trust from March 1999 to June 2011. Mr. Nekritz serves on the technical committee of FIBRA Prologis. Prior to joining the Trust in September 1995, Mr. Nekritz was an attorney with Mayer, Brown & Platt (now Mayer Brown LLP). Mr. Nekritz holds a Juris Doctor degree from the University of Chicago Law School and an A.B. degree in government from Harvard College.
Michael S. Curless:Curless
Chief Customer Officer
Years at Prologis: 17
Mr. Curless, 57,59, has been our chief customer officer since March 2019. Mr. Curless was our chief investment officer from June 2011 until March 2019. Mr. Curless was chief investment officer of the Trust from September 2010 to June 2011, and he was with the Trust in various capacities from August 1995 through February 2000. Mr. Curless was president and a principal at Lauth, a privately held national construction and development firm, from March 2000 until rejoining the Trust in September 2010. Prior thereto, he was a marketing director with the Trammell Crow Company. Mr. Curless holds a Master of Business Administration in finance and marketing and a Bachelor of Science in finance from the Kelley School of Business at Indiana University.
Mr. Curless will retire as our chief customer officer on April 1, 2023, and will remain with the company until the end of 2023 as part of the transition plan. Scott Marshall will become our chief customer officer on April 1, 2023.
|
|
Environmental, Governance Priorities |
Approach to ESG Priorities
At Prologis, our environmental, social and governance (ESG) priorities influence the implementation of our business strategy. We support innovation and inclusion; minimize our environmental impact, including our emissions; and strengthen our relationships with customers, employees and communities.
This integrated approach impacts every aspect of our company. Prologis’ nearly 2,500 employees work to create the conditions and set the standards for the future of logistics real estate. Our ESG priorities include four key areas of focus: We stay ahead of what’s next; deliver sustainable logistics solutions to our customers; inspire our people; and build resilient communities.

|
|
|
| |||||||||
| AHEAD OF WHAT’S NEXT | SUSTAINABLE LOGISTICS | INSPIRED PEOPLE | RESILIENT COMMUNITIES | |||||||||
A key Prologis attribute is our intense drive to stay ahead of what’s next. We leverage the scale of our global real estate portfolio and | Our approach to sustainable logistics is customer centric. This includes reducing energy use and emissions and providing energy generation, energy storage and mobility solutions for our customers. | Our employees are the foundation of our business. They implement our strategy and create value for our customers and shareholders. Our culture is key: Our people work towards an inclusive workplace; they are encouraged to listen, question and commit; and they innovate to create the future. | We create economic opportunity to help build resilient communities. We work in partnership with local leaders and organizations to build job training programs; promote health and safety; and enhance park and transit infrastructure. | |||||||||


Environmental Stewardship, Social
Responsibility and Governance
ESG UNLOCKS VALUE FOR PROLOGIS
ESG is essential to our value-creation strategy, delivering quantifiable benefits today and for the long term
PROLOGIS PROXY STATEMENT | MARCH 24, 2023 | 30 |
| ENVIRONMENTAL, SOCIAL AND GOVERNANCE PRIORITIES |
For nearly four decades,

We Stay Ahead of What’s Next
Prologis has a significant presence in the world’s most vibrant centers of commerce. We provide comprehensive real estate services including leasing; property and asset management; development; acquisitions; dispositions; and a suite of services through our Essentials platform. We have been a leader in ESG since our founding. We’ve been recognized as a leading REIT in corporate governance for 20 consecutive years and, in 2018, were the first logistics REIT to have an approved science-based emissions-reduction target. Our work across ESG is driven by our customers. As we look to the future, we expect to see continuing growth in consumption. This means our customers will continue to prioritize speed to market, inventory and flexibility. These factors create increasing demand for warehouse space and logistics services—and position us for sustained long-term success. Our culture of innovation helps us achieve strong business outcomes that benefit our employees, customers, partners and shareholders. This focus helps us future-proof our assets and stay ahead of what’s next: · Our Global Insights and Research group works to understand and describe worldwide market dynamics and key demand drivers for logistics real estate. As an example, their 2022 report on e-commerce stated that after making an online purchase, more than 90% of consumers expect delivery in three days or less. This highlights the importance of locating logistics facilities close to population centers. · Since 2016, Prologis Ventures has invested approximately $180 million in approximately 40 companies that specialize in one or more of the “Four Pillars” of logistics essentials: operations, energy and sustainability, mobility and workforce. By exploring the cutting edge of logistics technology, Prologis can better anticipate—and meet—customer needs. |
SMART BUILDINGS INITIATIVE—FEATURE-RICH, FUTURE-READY
Our smart building initiative helps our commitmentcustomers optimize productivity, reduce move-in time and lower capital expenses.

PROLOGIS PROXY STATEMENT | MARCH 24, 2023 | 31 |
| ENVIRONMENTAL, SOCIAL AND GOVERNANCE PRIORITIES |

We Deliver Sustainable Logistics
Our customers are interested in reducing the impact of their logistics operations. This includes reducing their use of energy, which is typically responsible for about 15% of a warehouse’s total operating budget. They are also looking for ways to environmental stewardship, social responsibility and good governance (ESG) has made usachieve their own emissions-reduction goals. We offer a leader in our industry and beyond. ESG is woven into our fabric and informs decision-making from the boardroom to all cornersrange of our global operations. Our ESG focus:solutions, including:
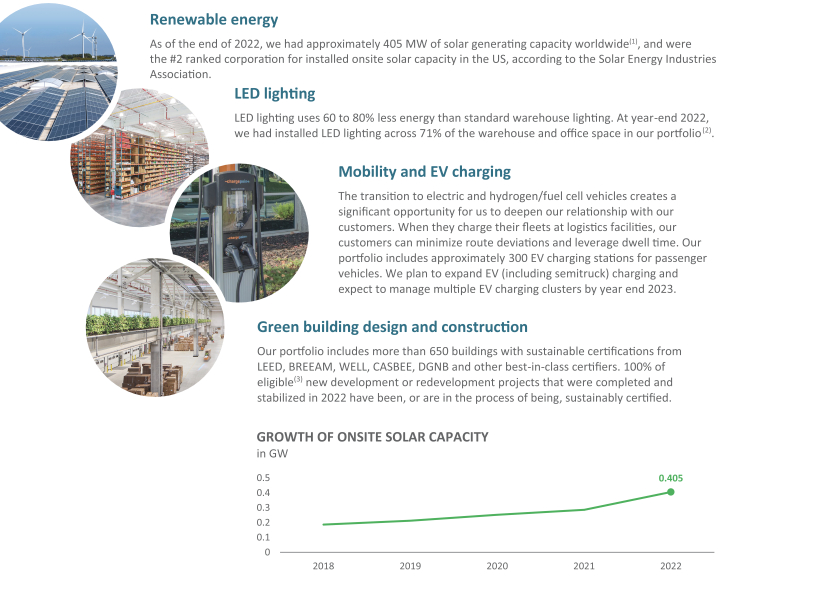
| (1) |
|
| (2) |
|
| (3) |
|
|
|
Prologis Park Venlo, Venlo, Netherlands
|
|
|
|
Leading
We Inspire Our People
We recruit talented employees with varied experiences and viewpoints. Then we work to retain them by providing opportunities to learn and develop.
Our most recent employee engagement pulse survey, completed by 92% of our employees in November 2022, indicates that 87% of employees are engaged based on their responses to the Wayfive questions that comprise our engagement driver index, including “I am proud to work for this company.” This compares favorably with the financial services sector industry average of 75%.
As of January 2023, according to Glassdoor, our CEO approval rating was 99%, and 88% of our employees said they would recommend Prologis to a Sustainable Futurefriend.
Our diversity, equity, inclusion and belonging (DEIB) vision is to leverage a diverse workforce and inclusive business practices to drive innovation and excellence by focusing on people, procurement, and philanthropy. We acknowledge we have work to do, particularly with respect to representation at our senior leadership level, and are implementing programs to help address this.

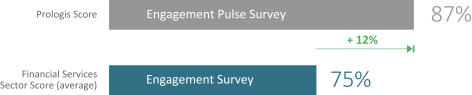
|
|
| ||||||
Different perspectives are strengths. The biggest danger for companies—particularly successful companies—is when they engage in group think. And group think comes from people who all have the same background, who’ve all gone to the same schools. After all, our customers are pretty diverse, our communities are pretty diverse, why shouldn’t our people be diverse? | ||||||||
Hamid R. Moghadam, Co-Founder, CEO and Chairman
|
PROLOGIS PROXY STATEMENT | MARCH 24, 2023 | 33 | |||||||

We Build Resilient Communities
Prologis builds resilient communities by improving the efficiency of the supply chain. We build, own and operate logistics facilities close to urban centers. This shortens delivery routes, reduces delivery times and reduces related emissions. Prologis’ customers and our customers’ customers (both business and residential) can benefit from next-day or even same-day delivery of the goods and services they need. Additional benefits can include plentiful logistics jobs, shorter commute times for logistics workers, reclamation and remediation of abandoned or brownfield sites and even enhancement of local parks and transportation infrastructure. · A study by the independent advisory firm Oxford Economics and commissioned by Prologis found that in 2022, $2.7 trillion in goods flowed through a Prologis logistics property. This represents 2.8% of all goods produced and sold globally. Nearly 1.1 million people work under a Prologis roof, most of whom are employees of our customers. · Through our Community Workforce Initiative, we’ve worked with community organizations to train approximately 21,000 people, and have helped place nearly 3,400 people in logistics jobs. |
Prologis Park DatteIn, DatteIn, GermanyECONOMIC IMPACT(1)
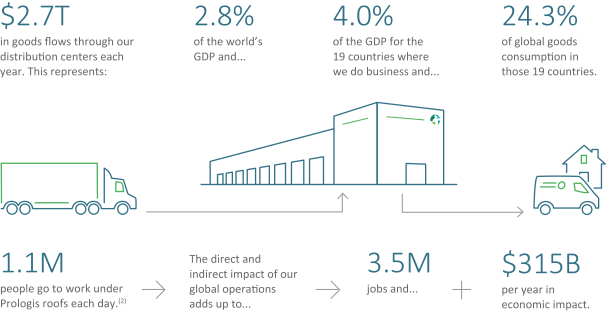
(1) |
|
| (2) | Customers’ employees make up a substantial majority of this figure. |
|
|
Prologis’Our ESG Goals Raiseand Progress
Our goals demonstrate our ambition, create accountability and drive alignment with our business strategy. They are influenced by our stakeholders and by third-party frameworks such as the BarUN Sustainable Development Goals.
We have made significant progress toward our ESG commitments and are on track to accomplish more, continuing to push the boundaries of ESG leadership globally.
| |||||||||
| |||||||||
 |
|
| |||||||
 | |||||||||
| Goal |
| ||||||||
| |||||||||
Net zero for scope 1, 2 and 3 emissions, | 2040 | Please see progress on interim goals, below | |||||||
Install 1GW of solar capacity (achieved prior goal of 400MW by 2025 three years early) |  |
| |||||||
Achieve sustainable building certifications | Annually | Achieved, or in progress of achieving, sustainable building certifications for 100% of eligible(2) projects | |||||||
Install LED lighting across 100% of our | 2025 |
| |||||||
Social Performance
| |||||||||
| Train 25,000 participants through our | 2025 |
| ||||||
 | Achieve 75,000 hours | 2025 |
| ||||||
Governance Performance
| |||||||||
 | Ensure 100% of employees complete ethics training | Trained100%
| |||||||

| (1) |
|
| (2) |
|
| (3) |
|
|
|
|
Delivering Sustainable Solutions to Our Customers
Prologis’ ability to help customers meet their sustainability goals is a competitive advantage for our business
Our customers understand the value of sustainability. For example, eight of our top ten customers have set their own carbon and/or energy reduction commitments. By leveraging our resources, expertiseRecent Awards and scale, we help customers meet their objectives and stay ahead of changing ESG expectations.
Our turnkey Prologis Essentials SolarSmart and LED solutions accelerate energy savings and environmental footprint reductions for our customers. With our strong value proposition, we proactively reach out to customers to discuss how Prologis can work side by side with them to enhance their sustainability performance.Honors
|
|
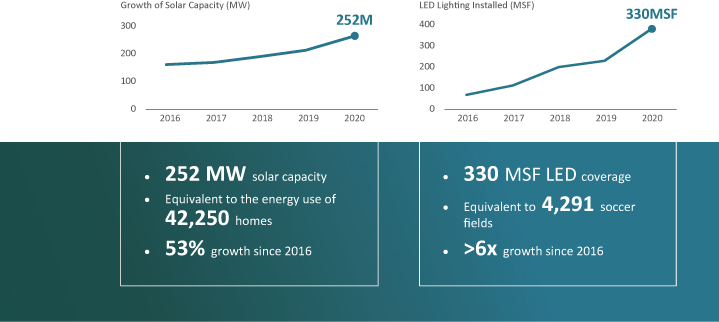
|
|

Building for Tomorrow, Today
Prologis’ scale and long-standing strategy to stay ahead of what’s next puts us in an ideal position to offer our customers state-of-the-art sustainable technologies such as EV infrastructure, building automation and smart meters.
Future-proofed by design, our buildings incorporate innovative technologies that promote high-efficiency operations, optimize the human experience and reduce occupational costs. We build to achieve independent, green building certification, showcasing sustainable building innovation that spans the globe: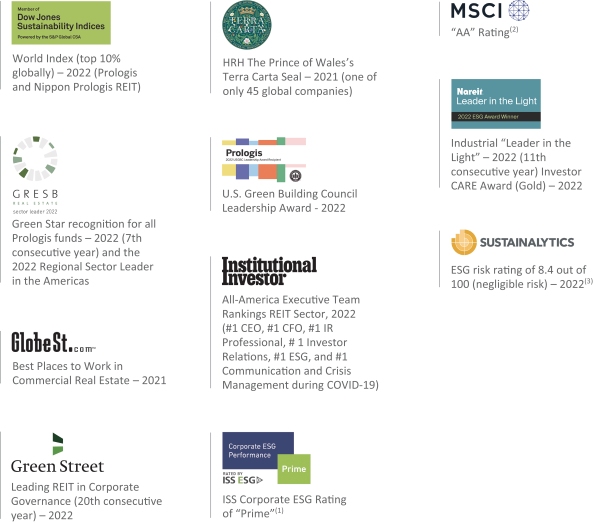
| (1) |
|
| (2) |
|
| (3) |
|
|
|
Prologis Park Waalwijk, Waalwijk, Netherlands
|
|
Committed to our Stakeholders During Unprecedented Times
We work hard to cultivate lasting relationships with our stakeholders. In turn, we build the foundation of trust that brings us together even in the most difficult times. As COVID-19 began to batter communities across the globe, we were ready. We mobilized our teams quickly to help our customers, communities and employees, working day and night to establish a fast-tracked structure for how to best deploy our resources to support those in need.

Logistics space donated through our Space for Good program in Dallas, Texas
|
| |||
|
| |||
|
| |||
|
|
|
|
|
36
|
SolutionsCreating Value through ESG
Customer Demand Fuels Opportunity
Whether they are multinational corporations or small businesses, many of our customers are interested in driving value through ESG performance. When we minimize the impact of construction, maximize building operating efficiency and provide value-added services such as electric vehicle (EV) charging and workforce development, we can help boost our customers’ bottom lines and help them achieve their ESG goals. When we engage proactively with the communities we serve, incorporate their ideas and minimize their concerns, we can build trust and create the conditions where both the business and community can flourish.
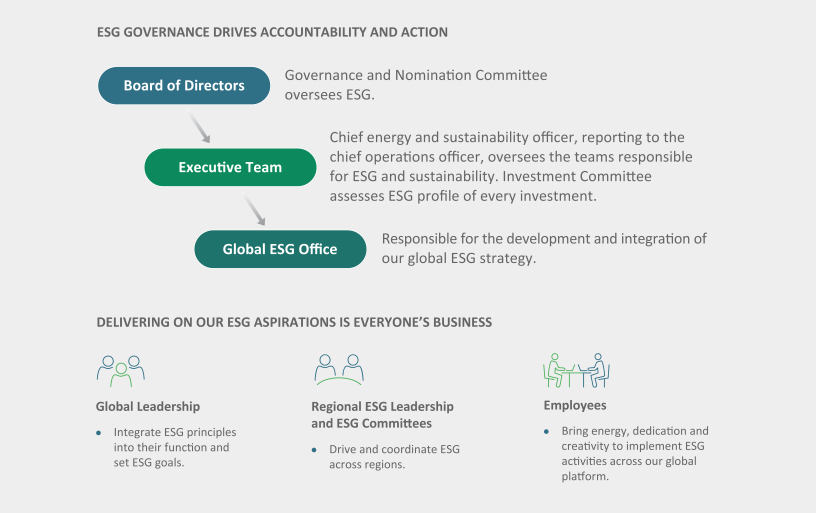
PROLOGIS PROXY STATEMENT | MARCH 24, 2023 | 37 |
| ENVIRONMENTAL, SOCIAL AND GOVERNANCE PRIORITIES |
Further Information on our ESG Performance and Approach
At Prologis, our ESG priorities influence our long-term success. We stay ahead of what’s next, deliver sustainable logistics, inspire our people and build resilient communities.
We welcome your feedback and ideas on how to improve the value of this disclosure: esg@prologis.com.
|
| |
ESG report and Executive Summary | Corporate website | |
| Our next ESG report and Executive Summary, to be published later in 2023, will provide more detail on our priorities, opportunities and achievements in ESG. | In addition, our corporate website provides ESG related information, updates and data.(1) This website is also where we publish our responses to ESG frameworks such as GRI, SASB, TCFD, CDP, PRI mapping and more. | |


| (1) | Information contained on or accessible through our website is not a part of this Proxy Statement. |
PROLOGIS PROXY STATEMENT | MARCH 24, 2023 | 38 |
Executive Compensation |
Compensation Discussion & Analysis
| 55 | 2022 Chief Executive Officer Compensation | |
| 60 | Core Compensation: Annual Bonus Opportunity | |
| 68 | ||
| 71 | Outperformance Compensation | |
| 79 | Other Compensation Elements and Considerations | |
All company operational information in this Compensation Discussion and Analysis is for the year ended or as of December 31, 2022, unless otherwise noted. See Appendix A for definitions and discussion of non-GAAP measures and reconciliations to the most directly comparable GAAP measures and for additional detail regarding definitions of terms as generally explained in this Compensation Discussion and Analysis. The Compensation Committee reviews management’s performance against key company performance measures, such as Core FFO per share, discussed below.
PROLOGIS PROXY STATEMENT | MARCH 24, 2023 | 39 |
| COMPENSATION DISCUSSION AND ANALYSIS |

CD&A Highlights
Continuous stockholder outreach enhances our compensation program
We responded to stockholder feedback by providing greater insight into the Compensation Committee’s NEO succession strategy, including the transition of future NEOs’ pay to reflect their tenure and experience. We also incorporated data metrics into NEO bonuses, which reflects the importance of data to our stockholders. Refer to page 43for further discussion of recent improvements we adopted based on stockholder input.
Prologis Promote Plan (PPP) supports Strategic Capital, a key driver of our growth
Our Customers’ Labor ChallengesNEO compensation reflects the performance of our entire global business that generates value for our stockholders. This includes our Strategic Capital business, which accounts for nearly half of our real estate portfolio.
Community Workforce Initiative (CWI)
· | PPP awards paid in 2022 were driven by a record-breaking “Promote” incentive fee received from Prologis European Logistics Fund (PELF), one of our largest Strategic Capital vehicles. Refer to page 77for detail on the PELF Promote, its performance hurdle and its value creation. |
· | Refer to page 78for the Committee’s long-term perspective on the variability of PPP awards and the significant value Strategic Capital has created for our stockholders. |
Prologis Outperformance Plan (POP) is a critical supplement to our long-term incentive (LTI) equity program from a talent retention and NEO succession perspective
Our lean talent base of only approximately 2,500 employees operates almost $200 billion in AUM with the specialized skills required to run our global real estate platform, Strategic Capital, Essentials and more. Refer to page 74for the Compensation Committee’s rationale about why POP is crucial to retain the best talent and develop an internal pipeline of future leaders.
Compensation expected to be recalibrated to lower levels for successor NEOs. Current CEO pay reflects the unique value delivered by our founder
Hamid Moghadam co-founded our company 40 years ago. He has attracted and led experienced NEO teams and built vital relationships across all aspects of our business. Such continuity of leadership enabled our annualized TSR to outperform the S&P 500 by 368 bps per year since our IPO in 1997. Since then, most of Mr. Moghadam’s compensation has been paid in equity, the majority of which he still owns. Refer to pages 54 and 55 to understand the Committee’s approach to successor NEO compensation and its rationale for the current design in the context of Mr. Moghadam’s unique position as a founder who has delivered decades-long outperformance.
PROLOGIS PROXY STATEMENT | MARCH 24, 2023 | 40 |
| COMPENSATION DISCUSSION AND ANALYSIS |
Letter from the Talent and Compensation Committee
To Our Stockholders:
Prologis’ continued operational strength in 2022—even in the face of volatile macroeconomic factors—was possible because our management team’s leadership positioned the company to thrive across cycles. We drove same store NOI(1) growth for the year to 7% on a net effective basis and ending occupancy to 98% globally. The strength of our balance sheet, low leverage and available liquidity, coupled with the added investment capacity provided by our Strategic Capital vehicles, positioned us to capitalize on strategic investment opportunities, such as the $1.7 billion “Urban Spaces” portfolio acquisition by our PELF vehicle. We also closed the $23 billion acquisition of another public REIT, Duke Realty Corporation, which was immediately accretive from a Core FFO(1) perspective and added 144 million square feet to our operating portfolio and $3.5 billion of potential development.
Continuity of experienced leadership has been critical to our long-term operational success. Our long-tenured NEOs developed our platform, built deep customer and partner relationships and formed our Strategic Capital vehicles over their multiple decades of service, which has ultimately resulted in our industry outperformance. Our ten-year annualized TSR outperformed the Cohen & Steers REIT Index by 830 basis points per year, with a cumulative TSR more than double the index’s cumulative TSR over this period. Our compensation program underpins these long-term returns. It includes substantial performance and vesting periods (such as POP’s three-year earning, seven-year cliff vesting construct) with significant pay potential for outperformance. This design also supports our succession strategy and helps provides a smooth transition to our next NEO team. Effective succession planning requires an adequate runway to train the next generation of NEOs across the breadth of responsibilities we expect our executives to handle.
During stockholder outreach over the past year, we discussed our approach to successor NEO compensation. As we transition to new leadership, the Committee will not default to executive pay levels based solely on compensation benchmarking. Rather, the Committee intends to assess the tenure and experience of each new NEO individually and, therefore, expects the target compensation of new NEOs will start at levels lower than the targets of their predecessors as well as the median pay of our compensation benchmarking peer group. In the past year, we successfully promoted two new executives from within—our CFO and president—as part of a planned transition with target pay levels tailored to their tenure and experience, which are lower than their predecessors’ targets.
Discussions with stockholders also focused on Strategic Capital and the related Prologis Promote Plan (PPP). In 2022, our Strategic Capital business reinforced its importance as a critical driver of our growth. The record $505 million of Promotes earned from Strategic Capital vehicles in 2022 more than doubled our previous annual record. Prologis also earned $535 million of recurring and transactional fees in 2022 from our Strategic Capital business. For comparison, the total amount of fees and Promotes earned from our Strategic Capital business in 2022 was over three times greater than the company’s total G&A expenses for the year. Strategic Capital enables us to grow our global platform efficiently and, with such scale, provide an ecosystem of Essentials customer products, services and solutions, which extracts extra value for our stockholders.
Recognizing that Strategic Capital is a key differentiator, we established PPP to drive the outperformance of our Strategic Capital vehicles. PPP awards can only be paid out of Promotes the company earns when the returns of the applicable Strategic Capital vehicle exceed an outperformance hurdle that is negotiated in advance at arm’s length with our third-party Strategic Capital investors, who have a strong interest in setting high-reach hurdles to drive significant returns. Given this structure, our record Promotes in 2022 resulted in large PPP awards to our NEOs. In light of the size of these awards, we continue to assess PPP and its outcomes carefully, including the context of overall quantum of NEO pay. The Committee continues to consider Mr. Moghadam’s long-standing record as an extremely high performing founder in assessing PPP award potential. Award opportunity reflects the outperformance potential of the Strategic Capital business he and his NEO team built that has delivered tremendous value to our stockholders over the decades of his tenure. Given the recalibration of compensation for new NEOs described above, we expect outperformance award allocations will be less for successor NEOs.
The Committee’s priority is the future of Prologis: being proactive in our approach to NEO succession planning and incentivizing performance in areas of emerging company focus while reinforcing current strengths vital to continued success, including our real estate operations and Strategic Capital business. In 2023, we continue to welcome your feedback and look forward to another year of enhancing our compensation program to stay future-ready.
 |
 |
 | ||

| (1) | Core FFO per share and SSNOI are non-GAAP measures. Please see Appendix A for a discussion and reconciliation to the most directly comparable GAAP measures. |
PROLOGIS PROXY STATEMENT | MARCH 24, 2023 |
41
|
Shannon LefflerSVP of Human Resources,Geodis in Americas
| COMPENSATION DISCUSSION AND ANALYSIS |
Technology
Stockholder Outreach and Building DesignCompensation Program Improvements
Our scale enables usSince our 2022 annual meeting, we connected with 71% of our top 100 stockholders.(1) The Chair of our Talent and Compensation Committee (“Compensation Committee” or “the Committee”) participated directly in all such meetings in which executive compensation and corporate governance was the primary focus.
| · | We solicit input from our investors regarding our performance, governance, executive compensation, human capital management, ESG and other matters. Our dialogue with investors deepens our Board’s understanding of stockholder areas of focus and provides investors with insight into our Board’s decision-making and processes. |
The feedback we heard from stockholders following our 2022 annual meeting and our responsive improvements to help our customers address their human capital challengescompensation program and other company initiatives are detailed on the following page.
Based on stockholder feedback and in line with the Committee’s continuous efforts to increase the rigor of our compensation targets to maximize company performance, we adopted a broad set of improvements to our compensation program that were detailed in our last proxy statement:
| · | Beginning with the 2022-2024 performance period, we increased the rigor of our LTI equity award scale: |
| – | We adopted a more demanding LTI payout target. Target pay (100% of award) is achieved only when we outperform the benchmark index by at least 100 bps (rather than target pay for at-index performance). |
| – | No payout will occur if performance is less than 500 bps below index TSR. This eliminated discretion to provide LTI equity awards in the event of below index performance. |
| · | Beginning with annual bonuses paid in 2023 for 2022 performance, quantitative ESG metrics aligned with our business strategy accounted for 10% of the corporate score used to calculate NEO bonuses. |
We received 84%(2) stockholder support for our say-on-pay proposal at our 2022 annual meeting. The Committee considers the voting results and feedback from many angles.our investors as important factors in our continual assessments of our compensation programs, decisions and policies.

| (1) | Calculated by outstanding shares of common stock of our top 100 stockholders. Our top 100 stockholders hold 80% of our outstanding shares. Engagement covered 43% of total shares outstanding and included outreach from after our 2022 annual meeting to March 2023. |
| (2) | Per Bylaws, calculated using a denominator adding the total number of votes cast for our Say-on-Pay proposal and votes cast against it. |
|
42 |
| COMPENSATION DISCUSSION AND ANALYSIS |
2022 STOCKHOLDER FEEDBACK | OUR RESPONSE | |||
Visibility into our PPP compensation decisions: Stockholders requested more visibility into our compensation determinations, especially with respect to Promote fee-earning opportunities. They also asked for further discussion of the Committee’s rationale for the structure of POP and PPP (our Outperformance Compensation). |
| Enhanced disclosure on Promote timing, 2022 PELF Promote and its performance hurdle and Committee rationale for Outperformance Compensation: In this proxy statement, we enhanced our disclosures on the timing of Promote-earning opportunities that generate PPP awards and provided additional detail about the Promote paid by PELF in 2022, including its performance hurdle. We also expanded on the Committee’s rationale behind both POP and PPP. | ||
Thoughtful NEO transition planning: Investors recognize that we are positioning the company for sustained long-term success with proactive NEO succession planning. They acknowledge that compensation opportunities support these efforts. Stockholders requested more disclosure on successor compensation planning. |
| Continued to implement our NEO succession strategy: Proactive NEO succession planning is a priority of the Committee and the Board. Long-term planning and training of potential successor NEOs (enabled by appropriate compensation to support retention) is being implemented. We also enhanced our discussion of the Committee’s succession strategy in this proxy statement. | ||
Approach for new NEO compensation: Stockholders appreciate that NEO compensation is not institutionalized by position, meaning that the Committee does not set compensation based only on title without regard to the individual executive who occupies the role. Rather, the Committee intends to make individualized compensation determinations for successor NEOs. |
| Recalibrated compensation of incoming executives: We set the compensation of two newly promoted executives (CFO and president) at levels that reflect their overall tenure at Prologis and professional experience, resulting in meaningfully lower total target compensation than their predecessors. The Committee intends to take this approach for future leadership transitions. | ||
Value of data: Stockholders voiced the importance of data to their analyses and to our continued growth and competitiveness. Our |
| Added data metric to | ||
ESG leadership: Stockholders noted their appreciation for |
| Continued to increase the rigor of our sustainability goals: In 2022, we continued to be an industry leader in ESG by committing to reach net zero emissions across our value chain by 2040. This goal supports our business strategy to provide renewable energy and decarbonization solutions to our customers. We also enhanced our gender pay equity reporting in our ESG report and adopted a political spending policy. | ||

|
|

Prologis has a deep commitment to maintaining robust stockholder engagement. For many years, we have continuously enhanced our executive compensation and corporate governance in response to stockholder feedback. The timeline below lists some of our notable enhancements that were formulated with stockholder input.
Culture and Talent: The Backbone of Our Success
Fostering talent and a strong corporate culture is one of our top three business imperatives. It drives results on our other two strategic priorities: customer centricity and change through innovation and operational excellence. To illustrate:
|
Prologis employees in Denver, CO
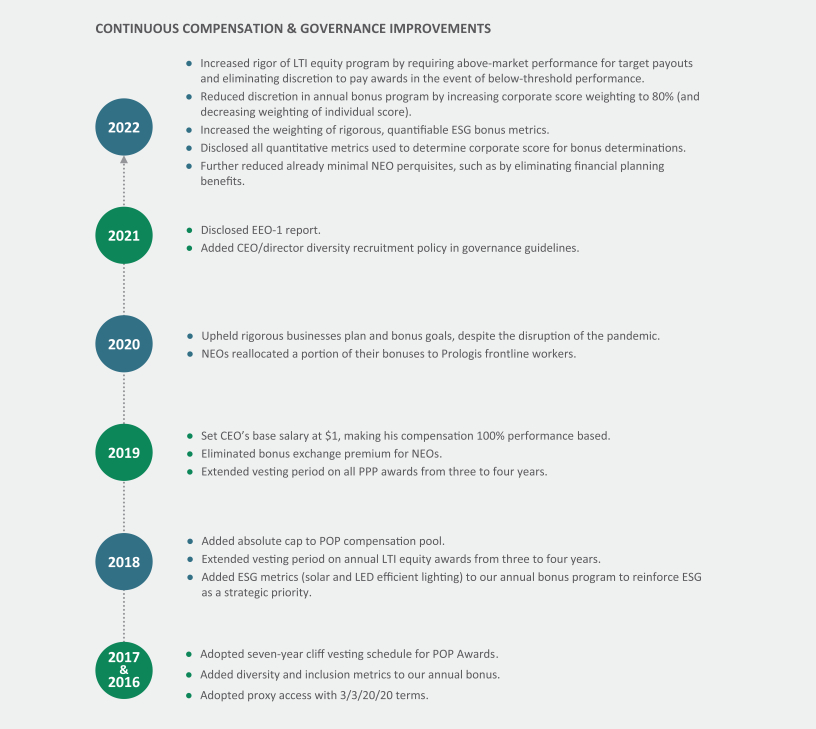
|
|
Prologis Pillars of Inclusion & DiversityBusiness Overview
Inclusion & Diversity (I&D)Prologis is the foundationglobal leader in logistics real estate with a focus on high-barrier, high-growth markets. We own, manage, lease and develop high-quality logistics facilities in 19 countries across four continents. Our portfolio is focused on the world’s most vibrant centers of commerce and our scale across these locations allows us to better serve our customers’ logistics requirements.
Our compensation programs are designed to drive the outperformance of our human capital program, focusedglobal logistics real estate business, including in our Strategic Capital vehicles. The Committee continually assesses our programs to find ways to use compensation to support areas of company expansion and diversification, such as in our Essentials platform and sustainability initiatives.
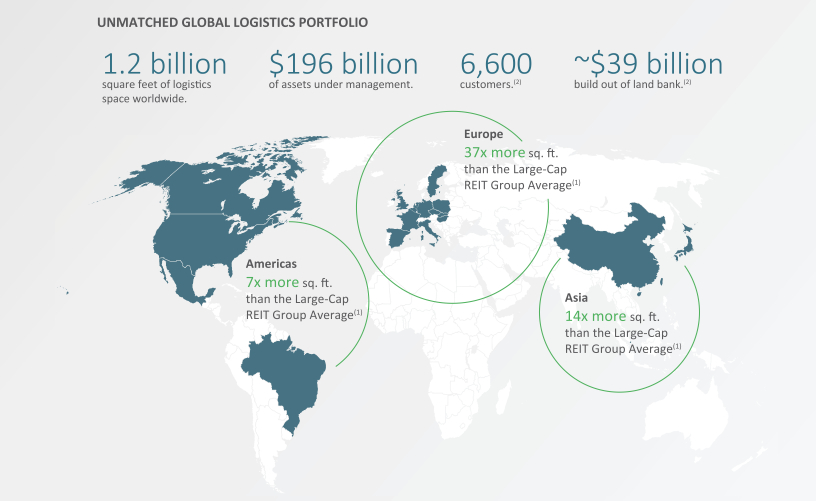
| (1) | Calculated based on square feet of our owned and managed operating portfolio. See definition of “Large-Cap REIT Group” on page 48. AUMs of Large-Cap REIT Group companies are derived from publicly available data as of December 31, 2022. Prologis AUM includes estimated investment capacity. |
| (2) | Customers occupying space in our owned and managed (O&M) portfolio. |
| (3) | Total expected investment. |
PROLOGIS PROXY STATEMENT | MARCH 24, 2023 | 45 |
| COMPENSATION DISCUSSION AND ANALYSIS |
Multiple differentiators define our industry-leading company
Customer-centric business model: We begin with our customers, who need well-located logistics space in the world’s highest consumption markets. We offer logistics facilities globally where our customers need to be, demonstrated by the fact that 76% of our top 25 customers lease space from us across multiple continents.
Comprehensive logistics ecosystem: We leveraged our size to create an unrivaled package of prime logistics real estate and complementary scale-enabled solutions that we designed to meet our customers’ evolving logistics requirements. These differentiators provide additional growth opportunities and further strengthen our customer relationships.
| · | Strategic Capital: This segment of our business, in which we jointly own logistics properties with institutional investors, provides a level of additional investment capacity unique to the REIT space and generates substantial, durable fee income. |
| · | Essentials platform: We offer an array of next-gen solutions, services and products to address our customers’ most pressing logistics needs in operations, energy and sustainability, mobility and workforce. |
| · | Ahead of what’s next: Prologis Ventures provides venture capital funding for high-impact, logistics-focused startups bringing new solutions to market for our customers. |
| · | Procurement advantage: Our global scale allows us to secure preferred pricing on key building materials and logistics equipment such as steel, forklifts and solar panels. |
| · | Tech-enabled, data informed: Early investments in technology and our vast, worldwide data pool provide actionable insights that drive optimization and competitive advantage for Prologis and our customers. |
OUR SCALE FUELS THE FUTURE
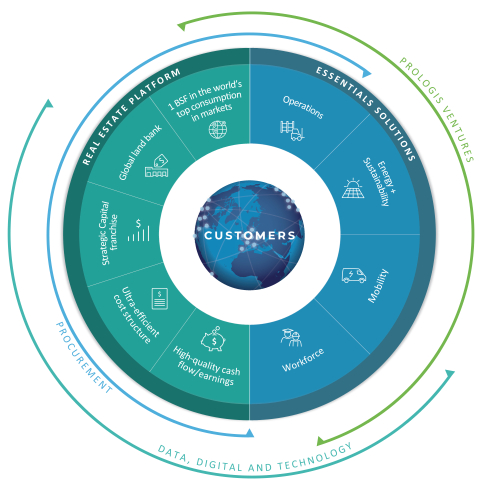
PROLOGIS PROXY STATEMENT | MARCH 24, 2023 | 46 |
| COMPENSATION DISCUSSION AND ANALYSIS |

Our business model is designed for resilience and responsible growth
Our forward-thinking strategy delivers results: We focus on advancing inclusive behaviorsvibrant consumption markets with large, dense populations, growing consumer affluence and countering unconscious bias. We are implementing core HR system enhancementshigh barriers to clarifyentry. With more than 1.2 billion square feet of well-located, high-quality logistics space, we have a unique ability to help our customers meet end-consumer delivery expectations across four continents and navigate the criterianovel challenges of the modern supply chain. Our ability to execute on our forward-looking strategy has resulted in sustained long-term returns for our hiringstockholders: our TSR CAGR over the past ten years was 7.3% higher than the Large-Cap REIT Group average.(1) Over that time, our TSR CAGR also outperformed the S&P 500 by 4.8%.(1)
Our industry-leading balance sheet positions us for strength in all operating environments: Our executive team’s prudent management of our balance sheet has prepared us to navigate potential headwinds and promotion decisionsact decisively when favorable opportunities arise. With Moody’s and require alignment with our staffing agencies. We train our global leaders via I&D-focused leadership development curriculumS&P credit ratings(2) of A3 and cloud-based mentoring.
We provide opportunities in the logistics industry for minority and underserved populations through our Community Workforce Initiative (discussed above)A (each stable outlook), as well as through partnerships with the Urban Land Institute and NAIOP. We fund scholarships for underrepresented students at partner schools and created the HiPE (High Potential Employee) rotational leadership program to give diverse candidates with STEM degrees exposure to our business. And in 2020, Prologis donated more than $1 million to charities fighting racial injustice.
Whilerespectively, we are proudthe top credit-rated REIT. As a result, in 2022 we were able to access financial markets globally at significantly low costs of the progresscapital, issuing $12 billion of debt at a weighted average interest rate of 3.0% and a weighted average term of approximately seven years. As of December 31, 2022, we have made, like achieving a roughly equal gender splithad over $4 billion of liquidity and our investment capacity across all employees, we know there is so much more to do. We remain committed to driving long-term, meaningful change both within Prologis and across the industry.our Strategic Capital vehicles totaled $20 billion.
We believe we are well-positioned to capitalize on growth opportunities: Our business model and financial health position us to take advantage of embedded growth potential and seize investment opportunities.

| · | Our global land bank includes approximately 7,588 acres focused on major urban centers and can support an estimated $39 billion of future development. Since 2016, our development business has deployed $15.6 billion with an IRR of 38%. We believe the strategic locations of our sites, coupled with our development expertise and ability to integrate sustainable design features, sets us up to capitalize on this portfolio. |
| · | Our M&A volume is unique in the REIT industry. From 2011 to 2020, we acquired four logistics companies in transactions collectively valued at $31 billion. In 2022, we acquired Duke Realty Corporation in a transaction valued at $23 billion, which expanded our presence in key target markets, provided growth from high-quality properties and added more than 500 new customers. |
| · | Due to strong market rent growth over the last several years, our in-place leases have considerable upside potential to drive organic growth. Our lease mark-to-market (which estimates how much higher market rents are compared to our in-place rents) was approximately 67% as of December 31, 2022. As such, we expect lease renewals to translate into significant increases in future rental income. |
STRONG, INTERCONNECTED ENTERPRISE GENERATED SIGNIFICANT VALUE IN 2022
|
|
|
| $4.9B |
|
| ||||||


Good Governance Protects Our Business
|
| |
Drone rooftop inspection at International Park of Commerce, Tracy, California
|
|
| $1.6B | ||||
in 2022 Rental Revenues. | of Strategic Capital Revenues in 2022. | in value creation from stabilizations in 2022. |
ESG Governance
| (1) |
|
| (2) |
|
|
|
|
|
|
|
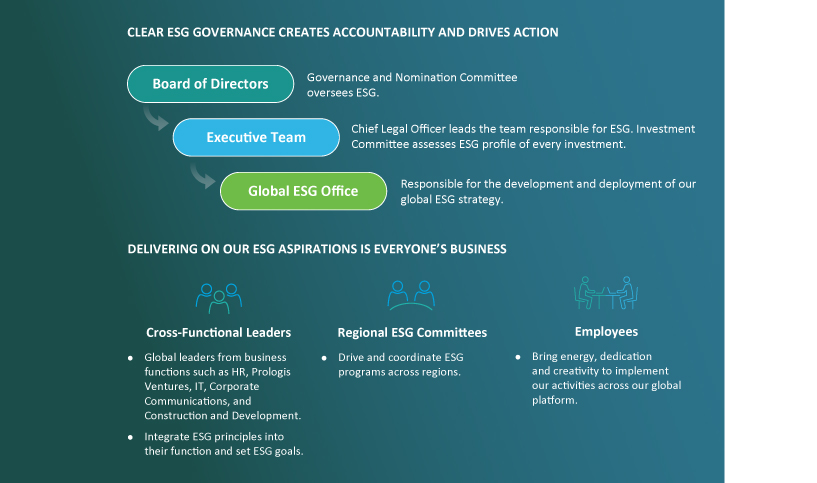
|
|
Recognition for Our ESG Leadership
In a world where choice matters – where customers have a choice of landlord, employees have a choice of employer, and communities with scarce infill real estate have a choice of developers – our ESG leadership makes Prologis the natural choice.
2020 awards and recognition
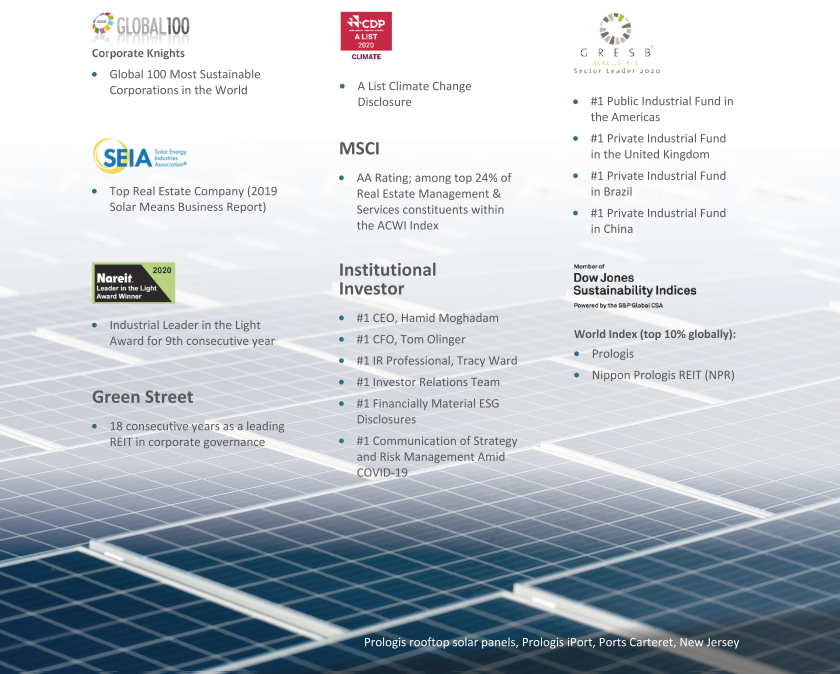
|
|
Compensation Discussion & Analysis
|
|
Compensation Discussion and Analysis Summary

|
|
| ||||||
|
|
|
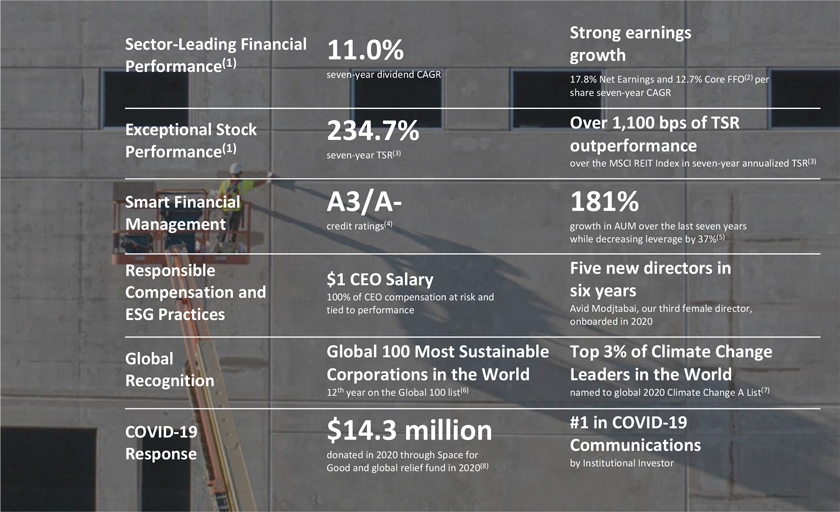
|
|
|
|
|
|
|
|
All company operational information in CD&A is for the year ended or as of December 31, 2020, unless otherwise noted. See Appendix A for definitions and discussion of non-GAAP measurements and reconciliations to the most directly comparable GAAP measures and for additional detail regarding definitions of terms as generally explained in CD&A. The Compensation Committee reviews management’s performance against key company performance measures, such as Core FFO per share, discussed below. See “2020 Compensation Decisions: Annual Base Salary and Bonus Opportunity” for more information about our key performance measures and targets.
|
|
2020 Compensation and Stockholder Outreach Highlights
Our compensation program pays when stockholders win.
|

STOCKHOLDER OUTREACH
| ||||||||
| Engaged more than | 85% | of our stockholders | (1)
| |||||
|
|
|
|
|
|
|
|
|
2020 NEO compensation highlights
|
|
|
|

|
|
|
Prologis business model is designed for growth and resilience.
|
|
|
|
|
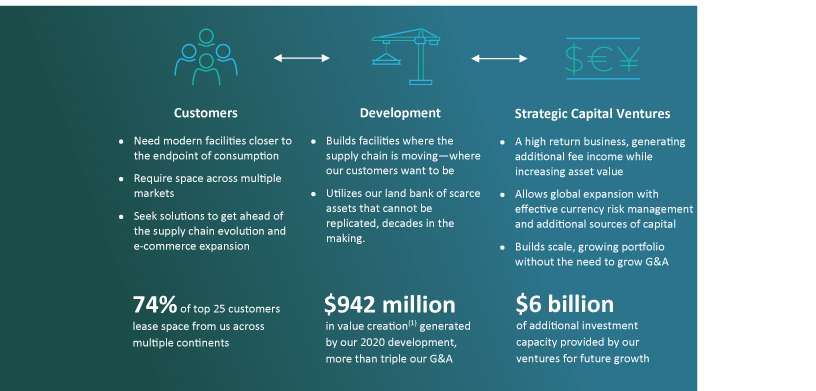
|
|
|
Our business model is a differentiator.
|
|
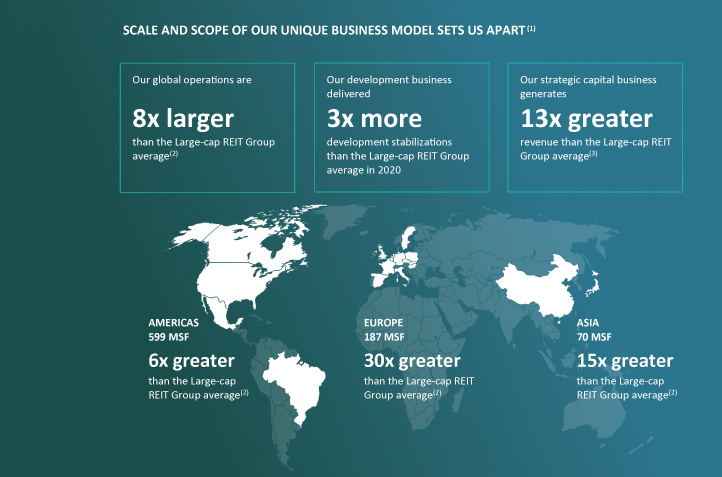
|
|
|
|
|
Unlocking advantages of scale for our customers
|
|
| |||
 |
|
| ||
|
|
| ||
|
| |||
 |
|
| ||
|
|
| ||


|
|
|
Our business delivers strong and durable long-term performance.
|
|
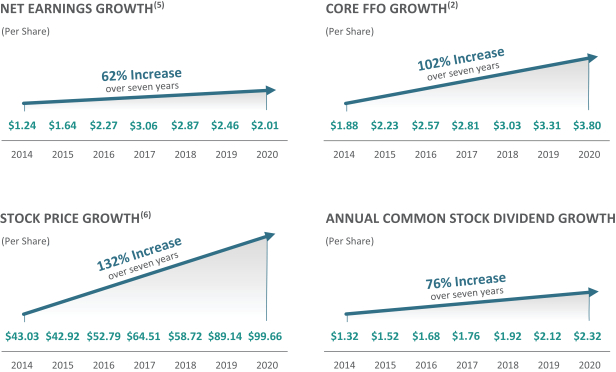
|
|
|
|
|
|
|
|
OUR MODEL DELIVERS STRONG LONG-TERM GROWTH RELATIVE TO PEERSOTHER REITS (1)
Total
| ||||
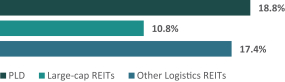 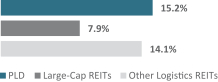 |
greater ten-year TSR |
greater ten-year TSR | ||
Stock Price CAGR
| Dividend CAGR(2)
| |||
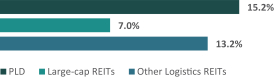 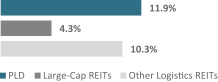 | 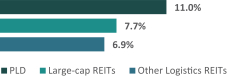 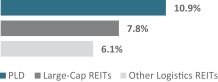 | |||
Net Earnings Per Share CAGR(3)
| Core FFO Per Share CAGR(4)
| |||
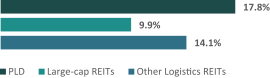 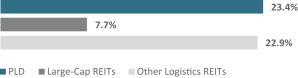 | 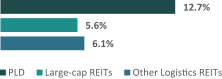 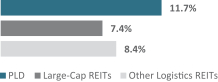 | |||
| (1) | Based on the weighted average market capitalization over the |
| (2) | Excludes companies that did not report dividends for the full |
| (3) |
|
| (4) | Core FFO per share is a non-GAAP measure. Please see Appendix A for a discussion and reconciliation to the most directly comparable GAAP measure. See Appendix A for a calculation of the CAGR of our Core FFO per share. Excludes companies that did not report FFO at all or for the full |
|
|

STRONG RISK OVERSIGHT PROTECTS LONG-TERM STOCKHOLDER VALUEStrategic Capital is a powerful differentiator
Loan-to-Market Value(1)In addition to owning assets directly, we partner with institutional investors to jointly own other properties through co-investment vehicles in our Strategic Capital business. At present, we operate nine total vehicles, including seven private vehicles and two that are publicly traded. Prologis manages the assets owned by the vehicles, using our industry expertise to deliver substantial returns to our Strategic Capital partners and ultimately to our stockholders. Our Strategic Capital business is akin to the private equity businesses of companies such as Blackstone Inc. and KKR & Co., yet these companies paid significantly greater compensation to their chief executive officers over the last three years than the total compensation (including POP and PPP) paid to Prologis’ CEO over the same period.
Accelerates our growth: As of the end of 2022, our Strategic Capital vehicles provided an additional $1.5 billion in investment capacity that we can use to grow our business.Strategic Capital allows us to self-fund capital development without the cost and delay of having to access public equity markets for annual deployment needs, unlike competitors who issue new equity to raise capital. Prologis develops and contributes properties to Strategic Capital vehicles in return for contribution proceeds, which we recycle back into our development platform and deploy to build additional facilities, resulting in a powerful cycle of value creation and reinvestment.
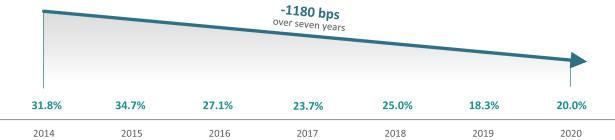
|
Our business model and top-rated balance sheet position us for strength in all operating environments
| · |
|
| · |
|
|
Mitigates foreign currency risk: Our properties located outside the U.S. are held primarily in Strategic Capital vehicles that Prologis jointly owns with Strategic Capital investors. This structure allows us to reduce our exposure to foreign currency movements for investments outside the U.S.

STRATEGIC CAPITAL PLAYS A VITAL ROLE IN OUR OVERALL ENTERPRISE
| ||
|
| |
|
| |
|
|
|
|
|
|
Discussion of Compensation Comparison Group
No REITs provide a true comparison to Prologis.
|
| ||||||||
|
Earnings Stream |
|
|
| ||||
|
|
|
| |||||
|
| |||||||
|
| |||||||
| ||||||||
|
|
| ||||||
|
|
| ||||||
| ||||||||
| ||||||||
|
|
| ||||||
|
| |||||||
|
|
|
|
|
|
Assets under management (AUM) reflects the full scope of our operations, 147% larger than other large-cap REITs.(1)
|
|
|
| |||
| Our Strategic Capital income has more than doubled over the last ten years and contributed over $735M to Core FFO in 2022.(1) |
| (1) |
|
|
PROLOGIS AUM VS. AUM OF LARGE-CAP REIT GROUP AND OTHER LOGISTICS REITS(2)
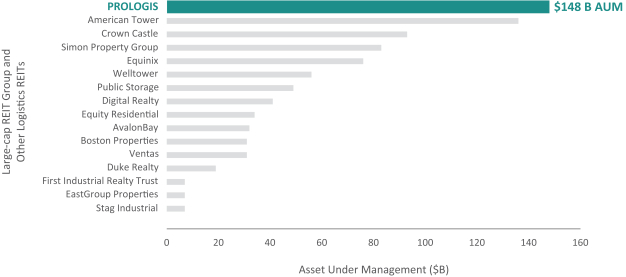
|
|
|
Our substantial asset growth in 2020 and the evolution of our business prompt need to reassess peer group.
|
|
|
|
Target core compensation did not increase as a result of peer group methodology changes.
|
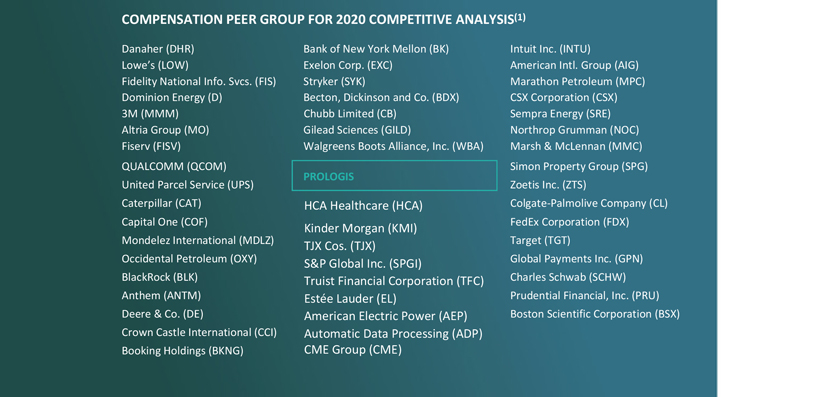
|
|
|
Target compensation is geared to the median of the peer group. Outperformance compensation is paid if significant above-market value is realized by stockholders.
|
|
PROGRAM COMPONENTS REFLECT A BALANCE OF TSR AND OPERATIONAL PERFORMANCE METRICS
| ||||||
|
| |||||
|
|
|
| |||
|
|
|
Discussion and Analysis of CEO Compensation

|
|
| ||||
|
|
| ||||
Prologis Park Pineham, Northampton, UK
|
|
|
PROLOGIS PROXY STATEMENT | MARCH 24, 2023 | 49 |
| COMPENSATION DISCUSSION AND ANALYSIS |

Essentials provides additional growth opportunities
Our scale allows us to go beyond the capabilities of a typical real estate company. Our Essentials platform offers solutions, services and products to address some of our customers’ most critical logistics needs in four key areas, underpinned by venture capital and technology to stay on the cutting-edge. We view Essentials as a win-win customer proposition: we strive to forge stronger customer relationships by delivering cost-savings and operational efficiencies while simultaneously developing additional income streams.
UNLOCKING ADVANTAGES OF SCALE FOR OUR CUSTOMERS
 |  | PROLOGIS VENTURES Our venture capital group provides funding and incubation for SUSTAINABILITY AMBITION In 2022, we pledged to achieve net zero emissions across our value chain—including Scope 3 emissions—by 2040. This reflects our long-term goal to deliver sustainable energy solutions to support our customers’ decarbonization efforts. DATA, DIGITAL AND TECHNOLOGY We integrate data innovations, digital enhancements and state-of-the-art technologies to optimize productivity for our customers and in our own business. | ||||||
Reduced operating costs As one of the | Sustainable power sources We’ve installed approximately 405 megawatts of solar generation, enough to power over 70,000 average U.S. households, making us the #2 overall company in the U.S. for corporate onsite solar capacity.(2) Our sustainable energy programs support our customers’ transition to clean energy. | |||||||
 |  | |||||||
Labor pain point solutions The digital training platform of our Community Workforce Initiative focuses on building a skilled and ready labor pipeline for our customers and creating economic opportunities in our communities. At year-end 2022, we had trained approximately 21,000 individuals through our CWI program. | Powering EV fleets We’re assisting our customers’ transition to electric fleets by installing charging stations at sites around the world. We provide a unique charging-as-a-service solution, which means we operate the charging infrastructure with no upfront capex from our customers. |
| (1 | Within our owned and managed operating properties. Does not include properties from the Duke and Urban Spaces acquisitions. |
|
PROLOGIS PROXY STATEMENT | MARCH 24, 2023 | 50 |
| COMPENSATION DISCUSSION AND ANALYSIS |
Compensation Benchmarking Peer Group
Our Peer Group methodology accounts for our total size and revenues, the diversification of our global business and our need to tap talent markets beyond real estate
The Committee recognizes that Prologis’ peer group should reflect the differentiated elements of our global business. With guidance from Pay Governance, the Committee’s consultant for 2022, and input from stockholders, the Committee built our peer group (our “Peer Group”) to include peers of appropriate size and scale and to align with the following considerations about our continued growth and ongoing business transformation:
CONTINUED BUSINESS EXPANSION | + | COMPETITION FOR TALENT ACROSS INDUSTRIES | = | PEER GROUP REFLECTING PROLOGIS’ BUSINESS AND TALENT MARKETS | ||||
| We have transformed beyond a traditional REIT, evidenced by the growth in our worldwide operations, development platform, assets under management, Strategic Capital business and our enterprises beyond real estate, such as our Essentials platform and Prologis Ventures. As a result, there is no comparable REIT or other peer in the market. | We compete for talent with companies outside the REIT industry, including private equity firms and technology companies. We need employees with the finance skills to conduct complex transactions. We also require the expertise to manage global logistics operations and drive cutting-edge innovation in our Essentials business. | Our Peer Group should reflect our global scope and scale, and align with our key business and talent markets, which we consider to be (1) real estate, (2) business-to-business technology and (3) complex financial services and private equity. | ||||||
| · | Our Peer Group includes 19 companies of appropriate size and complexity, with revenues generally 0.6x to 3.0x our FY2021 revenues and market capitalizations from 0.25x to 3.0x our market cap(1). Our Peer Group also gives equal weight to the three industry sectors we identified as our business and talent markets. |
| · | Among these peers, Prologis was in the 86th percentile of market capitalization as of the end of October 2022, which was the most recent data available when the Committee performed its last competitive analysis of 2022 in December. As of October 31, 2022, our market capitalization was $102 billion versus a peer group average of $52 billion. Four of our selected peers had a market capitalization that was less than 10% of Prologis’ market cap. (1) Prologis was in the 28th percentile of this group for FY2021 revenue. |
| · | We include five REITs of appropriate size in our Peer Group. With $196 billion in assets under management (AUM), however, Prologis’ AUM is 311% larger than the Large-Cap REIT Group(2) average AUM of $62.9 billion.Moreover, Prologis is differentiated from most other REITs in terms of our scope and diversity of business ventures, including our Strategic Capital business and Essentials platform, as well as our unique global presence across 19 countries. Therefore, a peer benchmarking group comprised solely of REITs would be insufficient to represent the scale and nature of our business and the talent pool we target for recruiting. |
| · | Some of the REITs in our refined peer group similarly include technology companies in their own peer groups. |
| · | Accordingly, we selected peers that include a mix of large-cap REITs, business-to-business technology and financial services/private equity that better reflect the full scope and complexity of our business. |
PROLOGIS PROXY STATEMENT | MARCH 24, 2023 | 51 |
| COMPENSATION DISCUSSION AND ANALYSIS |
Notes to prior page:
| (1) | Market capitalization of Prologis and peers as of October 31, 2022. |
| (2) | See definition of “Large-Cap REIT Group” on page 48. AUMs of Large-Cap REIT Group companies are derived from publicly available data as of December 31, 2022. Prologis AUM includes estimated investment capacity. |
Our total revenue—including unconsolidated revenues from our Strategic Capital business—should be factored into peer group selection
Our consolidated revenues do not fully capture our Strategic Capital business: Our NEOs manage a business that is significantly larger than our consolidated revenues alone indicate. Of the $92 billion total AUM in our Strategic Capital business, $62 billion of those assets are held in our unconsolidated Strategic Capital vehicles. The assets held in our unconsolidated vehicles are not included in our consolidated balance sheet and, therefore, revenue associated with these assets is not reflected in our consolidated revenues.
Selecting peers based solely on consolidated revenues (and thereby comparing the total compensation of our NEOs to that of executives at other companies with significantly smaller AUM) disregards a large portion of our NEOs’ responsibilities related to the performance and operation of the real estate in our Strategic Capital vehicles. These duties include leasing, development, acquisition, disposition and maintenance of real estate; capital sourcing; financial, legal and tax planning; structuring and operating our nine Strategic Capital vehicles, including two public vehicles; and management of customer and investor relationships across numerous countries.
Peer Group for 2022:
REITS | FINANCIAL SERVICES & PRIVATE EQUITY | TECHNOLOGY | ||||||
· American Tower Corporation · Crown Castle Inc. · Equinix, Inc. · Ventas, Inc. · Welltower Inc. | · The Carlyle Group Inc. · Evercore Inc. · Jefferies Financial Group Inc. · Lazard Ltd · Northern Trust Corporation ·S&P Global Inc. · State Street Corporation | · Adobe, Inc. · Automatic Data Processing, Inc. · Global Payments Inc. · Intuit Inc. · Paychex, Inc. · ServiceNow, Inc. · Workday, Inc. | ||||||
PROLOGIS PROXY STATEMENT | MARCH 24, 2023 | 52 |
| COMPENSATION DISCUSSION AND ANALYSIS |
Our Compensation Philosophy
The Committee’s compensation philosophy emphasizes pay-for-performance alignment across all elements of our value-creating business
Paying for performance is our central compensation tenet: Annual bonuses, LTI equity, POP and PPP are each 100% based on performance in support of company operations and financial performance.
We customize our compensation elements: The components of our compensation program are specifically designed to support each driver of our business. We have compensation elements supporting progress toward annual strategic priorities, strong relative long-term stockholder return and outperformance in our Strategic Capital business.
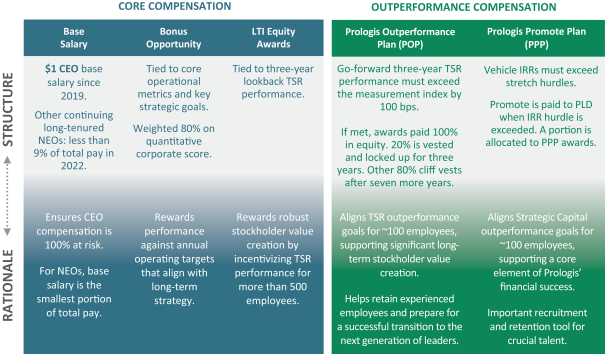
We position Core Compensation around our Peer Group median; Outperformance Compensation is paid only for significant above-market performance
The Committee aims target Core Compensation for current, long-tenured NEOs around the median of our Peer Group (see next page regarding compensation of newly promoted executives). The Committee’s 2022 competitive analysis confirmed that our current NEO Core Compensation is within a reasonable band of median Peer Group pay.
Outperformance Compensation is paid only when stockholders receive significant returns as measured by objective, formulaic hurdles. POP and PPP awards are only a small fraction of the total stockholder value created.
| · | POP and PPP allow us to attract and retain top talent from competitive, high incentive labor markets. Significant vesting periods (for example, seven years on the bulk of POP awards) encourage our top talent to stay with the company long term. This supports our investment in talent specifically trained to run our unique business. |
| · | Refer to pages 74 and 78 for more about the Committee’s rationale behind POP and PPP, respectively. |
PROLOGIS PROXY STATEMENT | MARCH 24, 2023 | 53 |
| COMPENSATION DISCUSSION AND ANALYSIS |

Compensation Committee Rationale: NEO Succession Planning
The Committee uses pay to support leadership succession and sets new NEO compensation based on tenure, experience and performance
Our long-tenured NEO team is key to long-term performance and succession plan: In 2022, the Committee reaffirmed its belief that our long-tenured NEOs who have an average tenure of over 25 years at Prologis and collectively over 175 years of experience, have been critical to Prologis’ operational and financial results. Importantly, each of our long-tenured NEOs has been in office for over 11 years since the AMB Merger in 2011, providing stable continuity of leadership that has helped build our business over the years. Furthermore, retention of our long-tenured NEOs has been essential to properly train potential successors.
Compensation of new NEOs expected to be recalibrated to lower levels: The Committee will assess any new NEO’s experience, performance and tenure when making compensation decisions. The Committee will not set new NEO compensation based solely on peer benchmarking. As such, we expect that new NEO compensation will not be at the same level as that of our long-tenured NEOs.
| · | Our current CFO’s Core Compensation targets for 2023 and Outperformance Compensation pool allocations are lower than the CFO targets and allocations of his longer tenured predecessor. Mr. Arndt’s LTI equity target for 2023 is about 17% lower than his predecessor’s final CFO target. His POP and PPP allocations for the relevant periods are only 2% and 3%, respectively, as compared to 4% or 6% for his predecessor in his final year as CFO. Note that Mr. Olinger’s POP and PPP allocations were reduced from 6% to 4% in connection with the planned CFO transition. |
| · | Similarly, when our current president was appointed effective January 1, 2023, his Core Compensation targets and POP pool allocation were set at lower levels than the targets of his predecessor in 2022. Mr. Letter’s base salary and LTI equity target for 2023 are 14% and 13% lower than his predecessors’ targets in 2022, respectively. His POP allocation is half that of Mr. Reilly’s for the relevant performance periods. |
| · | When new executives are appointed, the Committee intends to set their total target compensation (including Core Compensation, POP and PPP) below the median compensation of our Peer Group. The Committee expects that new executives’ total target compensation will move gradually toward the median of our Peer Group as they gain experience, conditioned on their successful performance in the role. |
|
| Former CFO (Tom Olinger) | Current CFO (Tim Arndt) | Former CIO (Eugene Reilly) | Current President (Dan Letter) | ||||
Compensation Element | Target Core 2021 performance year(1) | Target Core year(1) | Target Core year(1) | Target Core year(1) | ||||
Base Salary | $600,000 | $600,000 | $700,000 | $600,000 | ||||
Bonus | Target: $750,000 (125% of Base Salary) | Target: $720,000 (120% of Base Salary) | Target: $1,050,000 (150% of Base Salary) | Target: $780,000 (130% of Base Salary) | ||||
LTI Equity | Target: $2,100,000 | Target: $1,750,000 | Target: $2,600,000 | Target: $2,250,000 | ||||
POP and PPP Pool Allocations | ||||||||
POP | Performance periods starting between 2019 and 2022: 4% or 6% | 2023-2025 performance period: 2.5% | Performance periods starting between 2019 and 2022: 6% | 2023-2025 performance period: 3.5% | ||||
PPP | PPP pools funded between 2019 and 2021: 4% or 6% | 2022 PPP pool allocation: 3% | PPP pools funded between 2020 and 2022: 6% | Mr. Letter has not yet received a PPP award while president | ||||
| (1) | 2021 was Mr. Olinger’s final full year as our CFO. 2022 was Mr. Reilly’s final full year as our chief investment officer (CIO). Mr. Arndt was appointed CFO effective April 1, 2022. Mr. Letter was appointed president effective January 1, 2023. Our president fulfills the same duties previously assigned to the CIO. Based on current projections, we expect that Mr. Letter will be an NEO in our next annual proxy statement. |
PROLOGIS PROXY STATEMENT | MARCH 24, 2023 | 54 |
| COMPENSATION DISCUSSION AND ANALYSIS |
2022 Chief Executive Officer Compensation
The Committee assesses our CEO as a founder delivering long-term stockholder value
As part of its 2022 compensation review, the Committee considered whether our largely formulaic pay-for-performance program is working as designed to generate long-term returns for our stockholders. During that review, the Committee concluded that our CEO’s compensation is consistent with the tremendous long-term value he has delivered since co-founding our company four decades ago. The average tenure of an S&P 500 CEO in 2022 was 6.4 years. Mr. Moghadam has been an extremely high performing CEO for over 25 years, spanning our entire life as a public company. This is a unique intervening factor in the Committee’s compensation decisions.
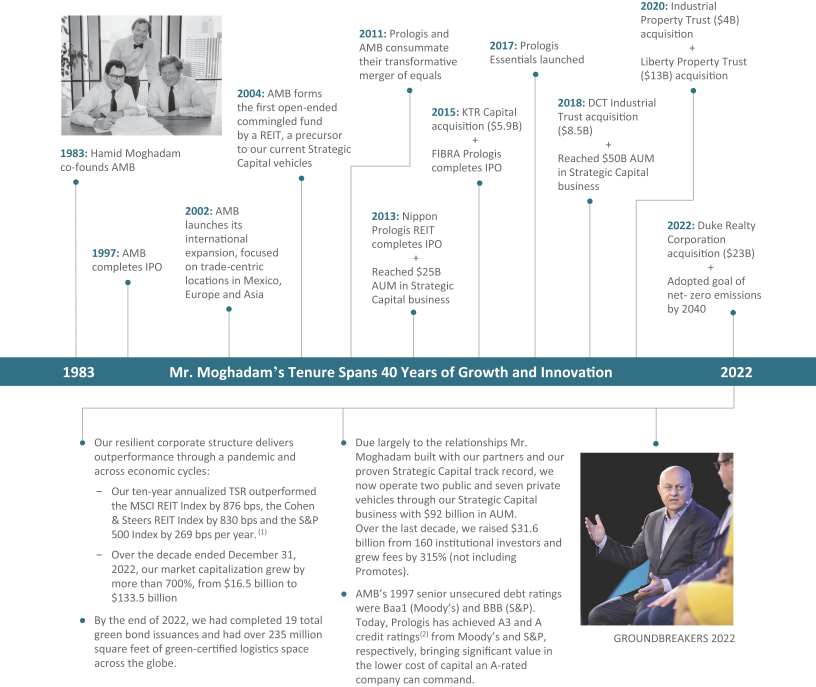
PROLOGIS PROXY STATEMENT | MARCH 24, 2023 | 55 |
| COMPENSATION DISCUSSION AND ANALYSIS |
Notes to prior page:
| (1) | Outperformance over the ten-year annualized TSR of the MSCI REIT Index, the Cohen & Steers REIT Index and the S&P 500. |
| (2) | A securities rating is not a recommendation to buy, sell or hold securities and is subject to revision or withdrawal at any time by the rating organization. |
2022 CEO Core Compensation
100% of our CEO’s compensation is paid in equity
At our CEO’s request, his base salary was reduced to $1 in 2019. The rest of our CEO’s previous base salary ($999,999) was shifted to at-risk pay in the form of equity compensation contingent on performance and subject to four-year vesting. The Committee determines the actual amount of equity paid in lieu of salary using the operational performance criteria from our annual bonus program.(1)
| · | As requested by our CEO to further demonstrate his commitment to our company, this change offers no additional upside to him. The amount he can earn as equity paid in lieu of salary is capped at $999,999 if the company meets its annual goals. If the performance goals are not achieved, this amount will be reduced. |
Mr. Moghadam has elected to take 100% of his bonus in equity every year in which he has received a bonus since our IPO in 1997(2), demonstrating his deep commitment to our stockholders.
As a result, essentially 100% of Mr. Moghadam’s total compensation is paid in equity (including Core Compensation as well as Outperformance Compensation). Since our IPO in 1997, most of Mr. Moghadam’s compensation has been paid in equity, the majority of which he still owns.
OUR CEO VOLUNTEERED TO DEEPLY ALIGN HIS OWN FINANCIAL INTERESTS WITH OUR STOCKHOLDERS’ INTERESTS
Our CEO’s total equity at the end of 2022 was over 50x greater than the minimum he is required to retain.(3)
| (1) | For the 2022 performance year, the Committee determined that the maximum value of this award ($999,999) would be paid if company performance was at or greater than target (using our corporate score assessed against our annual bonus plan metrics). As discussed in greater detail below in the section titled “2022 Core Compensation: Annual Bonus Opportunity,” our corporate results yielded above-target performance for 2022 and a corporate score for annual bonus purposes of 131.50% of target. As such, the Committee awarded Mr. Moghadam $999,999 in equity with four-year vesting in lieu of 2022 salary. Because this equity award was granted in 2023, it will be reported in our Summary Compensation Table for the year 2023. |
| (2) | AMB Property Corporation, which merged with ProLogis in 2011 to create the current company, completed its IPO in 1997. |
| (3) | Includes equity that counts toward the minimum stock ownership requirement applicable to our CEO. |
|
|
CEO performance record supports compensation payouts.Core Compensation correlates with long-term stockholder return
InThe chart below illustrates the link between (i) CEO Core Compensation (consisting of base salary, annual bonus and annual LTI equity awards), (ii) the company’s three-year TSR relative to the LTI Equity benchmark and (iii) Core FFO per share, (1) demonstrating that Core Compensation aligns with our outreach efforts, our investors told us they are highly impressed with Mr. Moghadam’s performancerelative TSR and appreciate the results he continually delivers to our stockholders. As a result of Mr. Moghadam’s leadership in the last seven years, we:operational performance.
| · |
|
| · |
|
| · |
|
|
CORRELATION OF CEO CORE COMPENSATION WITH RELATIVE THREE-YEAR TSR |
|
Our outperformance weathering the COVID-19 pandemic further evidences the value Mr. Moghadam continues to deliver to our stockholders. Our 1-year TSR was 14.6%, outperforming the MSCI REIT Index by 2,220 bps and the Cohen & Steers REIT Index by 1,962 bps at year-end 2020.(1)(5) Demonstrating the continued strength of our leasing operations, we delivered 21.3% growth in rent change on rollover in our owned and managed portfolio year-over-year in 2020.

| (1) |
|
|
|
|
|
|
|
2020 CEO Core Compensation
|
|
|
SUMMARY OF CEO CORE COMPENSATION FOR 2020 PERFORMANCE YEAR
Annual Base Salary | Annual Bonus | Annual LTI Equity Award | Aggregate Core Compensation for 2020 Performance Year(1) | |||
Salary decreased to $1 in 2019 | For 2020 performance paid in 2021
Minimum: 0% Target: $1,500,000 Maximum: $3,000,000 | For 2018-2020 performance granted in 2021 (including performance-based equity compensation paid in lieu of salary) (2) | ||||
$1 | Paid at 100% of target ($1,500,000) | Paid at 150% of target $12,375,000 Plus $999,999 paid in lieu of salary | $14,875,000 |
|
|
CEO core compensation directly correlates with company performance.
|
|
|
|
|
CORRELATION OF CEO CORE COMPENSATION WITH TSR AND OPERATIONAL PERFORMANCE
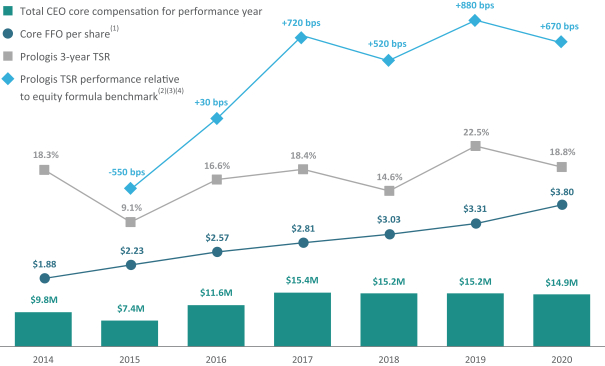
|
Represents the difference between PLD’s |
For the 2014 performance year, the benchmarks of logistics and large cap REITs that were used in our equity award decisions were not aggregated into one weighted benchmark. We instituted our equity award formula starting with the 2015 performance year. |
|
$24.2 billion in value created for stockholders when POP compensation was awarded.
|
|
|
|
|

2022 CEO POP Compensation
$22.4 billion in value created for stockholders when POP compensation was awarded
By exceeding the MSCI REIT Index three-year compound annualized TSR for the 2020-2022 performance period by more than 100 bps, we created $22.4 billion of value for our stockholders above the measurement index. Out of that amount, our CEO earned a $15.0 million POP award. Together with the $3.4 million holdback award earned from the 2017-2019 performance pool, the total POP awards paid to our CEO were only 0.08% of the $22.4 billion in outperformance value generated for our stockholders.
CEO POP AWARDS(1) ARE A SMALL FRACTIONWERE ONLY 0.08% OF THE TOTAL VALUE CREATEDGENERATED FOR STOCKHOLDERS IN EXCEEDING POP HURDLES(2)
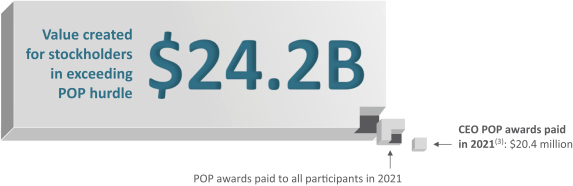

CEO POP awards were 0.08% of value generated for stockholders by
exceeding POP hurdle

| (1) | CEO POP award for the |
| (2) |
|
| (3) | The |
|
|
2022 CEO PPP Compensation
$2.61.8 billion in value created for stockholders when PPP compensation was paid.
|
|
|
|
|
|
|
paid
|
For additional detail regarding the 2022 Promote from Prologis European Logistics Fund (PELF) that gave rise to PPP awards in 2022, including the performance hurdle required to earn the Promote, please refer to page 77. |

CEO PPP AWARDSARE A SMALL FRACTIONAWARD WAS ONLY 1.6% OF THE TOTAL VALUE CREATED FOR STOCKHOLDERS WHEN WE ACHIEVED PPP HURDLES(1)
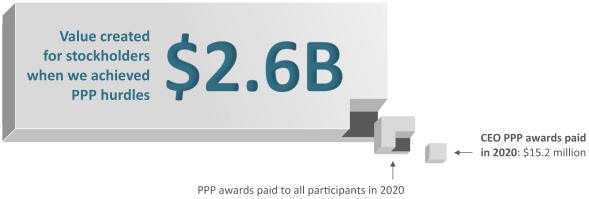

CEO PPP awards were 0.6% of the total value created for stockholders when we achieved the promote hurdles
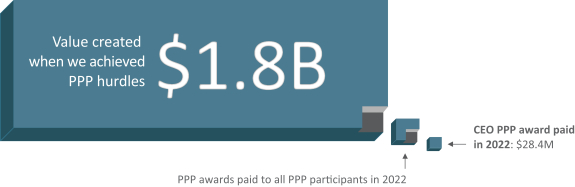
| (1) | The “total value created |
|
|
HOW IT WORKS Core Compensation: Annual Bonus Opportunity
| HOW IT WORKS |
Bonus Calculation Process
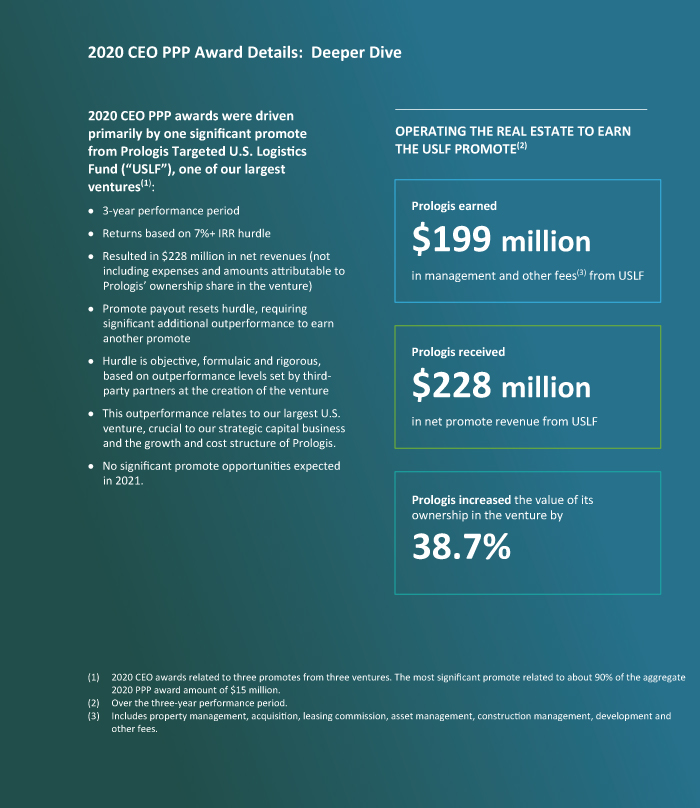
Corporate Score Determination:
| · | We determine a corporate score based on performance measured by operational metrics supporting our strategic priorities. |
| · | Metrics are divided into four categories and weighted according to their significance (see scorecard below). |
| · | Each metric is assessed based on company performance, which generates a score for each of the four bonus categories. |
| · | The category scores are multiplied by the weight assigned to the category and added together to determine the overall corporate score (which translates into a percentage of the target bonus pool). |
| · | The corporate score is set in a range between 50 and 200% of target (50% if threshold performance is achieved; 200% maximum if stretch performance hurdle is achieved). |
NEO Bonus Calculation: · The corporate score determines 80% of our NEOs’ bonuses, with the remaining 20% based on individual performance supporting company strategic priorities. Key NEO Bonus Features: · All bonuses are 100% based on performance in support of our business plan. · There is no minimum guaranteed bonus. ·Bonus payments are capped at 200% of target bonus. · Demonstrating their commitment to the company, all NEOs opted to receive their 2022 bonuses in LTIP units, which have a minimum two-year holding period. |
2022 BONUS SCORECARD FOR CORPORATE SCORE
| METRICS | CATEGORY WEIGHTING |
Portfolio Operations: · Core FFO Per Share · Same Store NOI Growth - Net Effective · Net Promoter Score · Essentials Contracted Sales · Essentials Contribution | 60% | |||
Deployment and Development Stabilizations: · Development Stabilizations · Development Stabilizations - Margin · “Build to Suit” Percentage of Total Development Starts · Contributions to Strategic Capital Vehicles | 20% | |||
Strategic Capital: · Equity Investments from Third Parties in Strategic Capital Vehicles | 10% | |||
| METRICS | CATEGORY WEIGHTING |
ESG: Environmental · Solar Megawatts Installed · Percentage of LED Lighting Installed Across O&M Portfolio (by area) · Percentage of New Developments Certified Sustainable (LEED or equivalent) Social · Number of New Community Workforce Initiative Engaged Learners · Culture & Talent Composite Score · IMPACT Volunteer Hours Governance · Composite corporate governance score across three third-party assessments | 10% | |||
|
|
2020 Compensation Decisions: Annual Base Salary and Bonus Opportunity
CEO base salary continues at $1; No increases made to NEO base salaries.
|
|
|
|
|
|
HOW IT WORKS
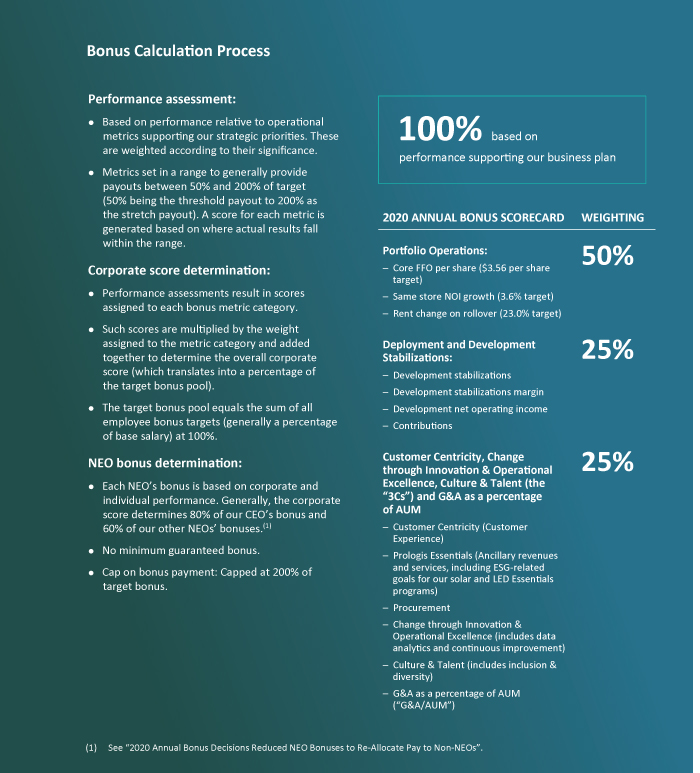
|
|
Our bonus structure supports our top strategic priorities. No changes made to pre-pandemic 2020 bonus metrics.priorities
How we select our bonus metrics and set our targetstargets:
Our bonus metrics are set annually to reflect the company’s business imperatives for that performance year and to tie to our three-year strategic plan:
| · |
|
We set targets to incentivize progress |
| · |
|

OUR BONUS TARGETS ARE RIGOROUS
14% higher
20202022 target Core FFO per share(1) comparedrequired 9% greater performance than
Core FFO per share achieved in 2021.
| (1) | Core FFO per share is a non-GAAP measure. Please see Appendix A for a discussion and reconciliation to the most directly comparable GAAP measure. See footnote 3 on page 48 for further detail regarding our net earnings per share CAGR calculation. |
Portfolio Operations metrics are the most heavily weighted:
Our 2022 bonuses were largely determined by our performance on operational metrics in the Portfolio Operations category (weighted at 60% of our total corporate score). These operational metrics for 2022 were (i) Core FFO per share, (ii) Same Store NOI Growth – Net Effective, (iii) Net Promoter Score, (iv) Essentials Contracted Sales and (v) Essentials Contribution. We believe these metrics have considerable impact on our success and are important to 2019our stockholders in assessing the health and performance of our business.
6% higher
2020 target SSNOI growthOur 2022 Core FFO per share(1) comparedtarget was set at a rigorous level, requiring significantly better performance than in 2021. Our 2022 Core FFO per share target (excluding Strategic Capital Promotes) was set about 9% higher than our 2021 Core FFO per share performance (also adjusted to 2019exclude Promotes).
Certain targets might not show a year-over-year increase because of the underlying nature of the metric. For instance, Our Same Store NOI Growth – Net Effective target for 2022 was set at a rigorous level based on a lease-by-lease and property-level analysis conducted to determine targets based on market indicators. Because the composition of the pool of properties changes from year-to-year, SSNOI metrics year-over-year may not be comparable. Therefore, although set at rigorous levels for the current set of properties, SSNOI targets may not necessarily show an increase over the prior year’s performance.
Similarly, the metrics in the Deployment and Development Stabilizations category are a function of our development pipeline projections at the time bonus targets are set. Our target Contributions for 2022, which measures the value of stabilized properties contributed to our Strategic Capital vehicles, was $2.65 billion. We set this metric based on our then-current assessment of the properties that will be available to stabilize and contribute to Strategic Capital vehicles in the applicable year, which fluctuates. Likewise, our Development Stabilizations—Margin target for 2022 was set at 32.5%, which reflected our projected development pipeline for the coming year when bonus targets were set using our then-current estimates of labor, material and other costs.
In the same way that targets are set based on year-to-year projections, some metrics that appear in prior bonus scorecards might not appear in subsequent scorecards given our then-current operational priorities and evaluation of the most pressing factors impacting our business. When 2022 bonus metrics were set, we recognized that our Rent Change on Rollover and Average Occupancy (which were both included in the 2021 bonus scorecard) were already strong, so it was not necessary to drive their performance by including them in the 2022 scorecard. Likewise, we have
PROLOGIS PROXY STATEMENT | MARCH 24, 2023 | 61 |
| COMPENSATION DISCUSSION AND ANALYSIS |
already reduced our general and administrative (G&A) expenses as a percentage of AUM from 85bps to 31bps since 2011, so we chose to focus on other operational priorities by replacing this metric in our 2022 scorecard. Our Procurement Savings performance in 2021 far exceeded its 2021 target and is also a company strength given our scale-enabled purchasing power, so we determined it did not need to be included again in the 2022 scorecard.
We include rigorous, quantifiable ESG goals in our bonus program to support the various components of our industry leading ESG program and provide a measure of accountability for our progress. Environmental metrics—including solar, LED and certified sustainable development targets—advance our sustainability initiatives that also strengthen customer relationships and provide ancillary revenue. Social metrics—including related to our Community Workforce Initiative, Culture & Talent Composite Score and IMPACT Volunteer Hours—help foster an inclusive culture that we believe attracts and retains diverse talent. For governance metrics, we utilize third-party assessments to measure our corporate governance performance and strive to have strong, independently verified policies in place that provide for responsible governance in furtherance of our stockholders’ best interests.
As with other metrics in our bonus scorecard, ESG metrics are determined on a year-to-year basis using then-current assessments and projections of the coming year. For this reason, targets set for ESG metrics, such as our Culture & Talent Composite Score, might not reflect an increase from prior years’ performance.
NEOS VOLUNTARILY REALLOCATED PART OF THEIR BONUSES TO SUPPORT OUR 2022 DATA INITIATIVE
Our continuing NEOs voluntarily contributed 10% of their target bonuses to an incentive pool used to reward the broader company’s data collection efforts in 2022.
2022 bonus assessment results
Based on strong performance against the quantitative metrics of our bonus scorecard, the Committee concluded that our NEOs earned an above-target corporate score. Together with meaningful individual contributions in 2022, this resulted in NEOs earning bonuses of 131.50% of target.
Data centricity: Each of our continuing NEOs voluntarily contributed 10% of their target bonus amounts to an incentive pool allocated to other employees who were directly involved with data collection and verification to incentivize our company-wide data collection initiative. As such, the bonus amount paid to each continuing NEO for 2022 performance was reduced by 10% of their respective target bonus amount, resulting in NEO bonus payouts at 121.50% of target.
In addition, the company emphasized improving the completeness and quality of our data in 2022, which we view as essential to our ongoing growth. This included data on property characteristics, our Essentials business, leasing and customer contacts, construction and facilities management. In 2022, the company made 25% of NEO bonuses dependent upon 95% completion of our data initiatives. The company achieved 97% completion of this critical effort.
See the tables and discussion on the pages that follow for more detail about how our corporate score and bonus amounts were calculated.
PROLOGIS PROXY STATEMENT | MARCH 24, 2023 | 62 |
| COMPENSATION DISCUSSION AND ANALYSIS |
CATEGORY-BY-CATEGORY METRIC RESULTS
| PORTFOLIO OPERATIONS | WEIGHTED AT 60% | ABOVE TARGET OVERALL | ||||||||||||||||||
| Key Performance Metric | Metric Weighting | Threshold Performance 50% of Target Bonus | Target Performance 100% of Target Bonus | Stretch Performance 200% of Target Bonus | Scored 2022 Performance(5) | |||||||||||||||
Core FFO Per Share (excluding Promotes)(1) | 35% | $4.40 | $4.45 | $4.50 | $4.61 | |||||||||||||||
Same Store NOI Growth – Net Effective(2) | 5% | 3.75% | 4.25% | 4.75% | 7.0% | |||||||||||||||
NPS Score(3) | 10% | 55 | 65 | 70 | 63 | |||||||||||||||
Essentials Contracted Sales | 7.5% | $55M | $65M | $75M | $52.10M | |||||||||||||||
Essentials Contribution(4) | 2.5% | $65M | $70M | $75M | $68.82M | |||||||||||||||
Total Category Score |
| 150% of target | ||||||||||||||||||
| (1) | Core FFO per share and |
Same Store NOI Growth is based on our owned and managed portfolio. |
| (3) |
|
| (4) | Essentials Contribution includes the revenues less operating expenses and G&A of the Essentials business lines, and includes the tax credits generated for potential use or sale. |
| (5) | For comparison, actual 2021 performance |
DEPLOYMENT AND
DEVELOPMENT STABILIZATIONS | WEIGHTED AT 20% | ABOVE TARGET OVERALL | ||||||||||||||||||
| Key Performance Metric | Metric Weighting | Threshold Performance 50% of Target Bonus | Target Performance 100% of Target Bonus | Stretch Performance 200% of Target Bonus | Scored 2022 Performance(2)(3) | |||||||||||||||
Development Stabilizations | 5% | $3.325B | $3.625B | $3.925B | $3.615B | |||||||||||||||
Development Stabilizations - Margin | 5% | 28.5% | 32.5% | 36.5% | 48.7% | |||||||||||||||
Build to Suit % of Total Development Starts(1) | 5% | 35% | 37.5% | 40% | 40.0% | |||||||||||||||
Contributions to Strategic Capital Vehicles | 5% | $2.40B | $2.650B | $2.9B | $1.533B | |||||||||||||||
Total Category Score |
|
|
|
|
|
|
|
|
| 133.50% of target | ||||||||||
| (1) | “Build to Suit” refers to the process by which Prologis builds a customized facility to meet the specifications of a certain customer. |
| (2) | For comparison, actual 2021 performance for metrics that were included in the 2021 bonus scorecard: Development Stabilizations ($3.411B); Development Stabilizations – Margin (45%); Contributions to Strategic Capital vehicles ($4.464B). |
| (3) | Performance targets and |
|
|
| STRATEGIC CAPITAL | WEIGHTED AT 10% | BELOW TARGET OVERALL | ||||||||||||||||||
| Key Performance Metric | Metric Weighting | Threshold Performance 50% of Target Bonus | Target Performance 100% of Target Bonus | Stretch Performance 200% of Target Bonus | Scored 2022 Performance | |||||||||||||||
| 10% | $1.6B | $2.0B | $2.4B | $778M | |||||||||||||||
Total Category Score | Below threshold | |||||||||||||||||||
| (1) | Includes contracted equity commitments from third parties to |
| ESG | WEIGHTED AT 10% | ABOVE TARGET OVERALL | ||||||||||||||||||
| Key Performance Metric | Metric Weighting | Threshold Performance 50% of Target Bonus | Target Performance 100% of Target Bonus | Stretch Performance 200% of Target Bonus | Scored 2022 Performance(5)(6) | |||||||||||||||
Environmental | ||||||||||||||||||||
Solar Megawatts (MW) Installed | 2% | 325MW | 350MW | 375MW | 379MW | |||||||||||||||
% LED Across O&M Portfolio (by area) | 1% | 62% | 67% | 72% | 76% | |||||||||||||||
% of New Eligible Developments Certified Sustainable (LEED or equivalent)(1) | 1% | 90% | 95% | 100% | 100% | |||||||||||||||
Social | ||||||||||||||||||||
Number of New CWI Engaged Learners(2) | 1% | 4,000 | 5,000 | 6,000 | 5,609 | |||||||||||||||
Culture & Talent Composite Score(3) | 2% | 60% | 70% | 80% | 77.9% | |||||||||||||||
IMPACT Volunteer Hours | 1% | 8,000 | 10,000 | 12,000 | 10,882 | |||||||||||||||
Governance(4) | ||||||||||||||||||||
Sustainalytics | .666% | 38 | 45 | 52 | 43.7 | |||||||||||||||
MSCI | .666% | -6.5 | -4.5 | -2.5 | -3.2 | |||||||||||||||
GRESB | .666% | 20 | 24 | 28 | 27.78 | |||||||||||||||
Total Category Score |
| 166.50% of target | ||||||||||||||||||
| (1) | Due to customer requirements and/or the limitations of |
| (2) |
|
The Compensation Committee’s approach to our 2020 bonus allocation
|
| (3) |
|
Corporate score and NEO bonus assessments
At-target bonuses awarded despite above-target achievement to reallocate funds to reward customer-focused non-NEOs
|
| (4) |
|
| (5) | ||||
|
|
| ||
Portfolio Operations | Threshold performance 50% of Target Bonus | Target Performance 100% of Target Bonus | Stretch Performance 200% of Target Bonus | Actual 2020 Performance | ||||||||||||
Core FFO per share (excluding | $ | 3.52 | $ | 3.56 | $ | 3.60 | $ | 3.58 | ||||||||
SSNOI Growth(1)(2) | 3.1% | 3.6% | 4.1% | 2.4% | ||||||||||||
Rent Change on Rollover(2)(3) | 21.1% | 23.0% | 25.0% | 21.3% | ||||||||||||
|
|
|
| OVERALL CORPORATE SCORE | 131.50% OF TARGET | ABOVE TARGET OVERALL | ||||||||
Determination of our corporate score: The weightings of the scores for the four categories yielded an overall corporate score of 131.50% of target. | ||||||||||
| INDIVIDUAL PERFORMANCE | EACH AT 131.50% OF TARGET | ABOVE TARGET OVERALL | ||||||||
The Committee’s assessment of Mr. Moghadam’s individual contributions: Under Mr. Moghadam’s leadership, the executive team led the company in another year of significant accomplishments. We closed the $23.2 billion Duke Realty Corporation merger and integrated the portfolio. Mr. Moghadam’s unrelenting focus on meeting our customers’ needs in all aspects of our business differentiates and positions us for strong long-term growth and continued market leadership. Under Mr. Moghadam’s guidance, Prologis’ annualized three- and ten-year TSR outperformed the Cohen & Steers REIT Index by 1,011 bps and 830 bps, respectively. Mr. Moghadam’s ongoing support for our diversity and inclusion initiatives in 2022 continued to foster an inclusive environment supporting the retention and development of an employee base with diversity of thought, experience and background, which we view as critical to driving innovation and performance. Mr. Moghadam also continued to leverage our unique vantage point in the heart of global logistics by bringing industry innovators from around the world together at our second GROUNDBREAKERS thought leadership forum, which provides a venue for in-depth examinations of emerging technologies and trends that are critical to our customers’ businesses and are transforming the supply chain.
The Committee’s assessment of other NEO contributions:
| · |
|
|
| · |
|
| · |
|
|
|
|
| ||
|
|
|
|
|
| ||
|
|
|
|
|
|
|
| · |
|
|
| · |
|
Balance Sheet Considerations
|
|
|
|
|
| ||
|
|
| (1) |
|
|
|
|
Ranking by SEIA in the 2022 Solar Means Business report. |
| (3) | A securities rating is not a recommendation to buy, sell or hold securities and is subject to revision or withdrawal at any time by the rating organization. |
|
PROLOGIS PROXY STATEMENT | MARCH 24, 2023 | 66 |
2020
| COMPENSATION DISCUSSION AND ANALYSIS |
2022 ANNUAL BONUS DECISIONS REDUCED NEO BONUSES TO RE-ALLOCATE PAY TO NON-NEOSPAYMENTS
At our NEOs’ election, all bonuses were settled in equity with a two-year holding period and not paid in cash, resulting in further alignment with stockholder interests.
|
| 2020 Bonus* | 2022 Bonus(1)
| ||||||||||||||||||||||||||||||
NEO | 2020 Target Bonus Value | Earned Bonus Prior to Reduction | Percentage Reduction | Amount Paid (100% of Target) After Reduction** | 2022 Target Bonus Value | % of Target(2) | % of Max | Amount Paid(4) | ||||||||||||||||||||||||
Hamid Moghadam | $1,500,000 | $1,752,000 | -14% | $1,500,000 | $1,500,000 | 121.50% | 61% | $1,822,500 | ||||||||||||||||||||||||
Thomas Olinger | $ 750,000 | $ 844,500 | -11% | $ 750,000 | ||||||||||||||||||||||||||||
Timothy Arndt(3) | $523,870 | 121.50% | 61% | $636,500 | ||||||||||||||||||||||||||||
Thomas Olinger(3) | $0 | N/A | N/A | $0 | ||||||||||||||||||||||||||||
Eugene Reilly | $ 750,000 | $ 844,500 | -11% | $ 750,000 | $1,050,000 | 121.50% | 61% | $1,275,800 | ||||||||||||||||||||||||
Edward Nekritz | $ 750,000 | $ 844,500 | -11% | $ 750,000 | ||||||||||||||||||||||||||||
Gary Anderson | $ 750,000 | $ 844,500 | -11% | $ 750,000 | $877,500 | 121.50% | 61% | $1,066,200 | ||||||||||||||||||||||||
Michael Curless | $ 750,000 | $ 844,500 | -11% | $ 750,000 | ||||||||||||||||||||||||||||
Edward Nekritz | $845,000 | 121.50% | 61% | $1,026,700 | ||||||||||||||||||||||||||||
Target bonus levels are based on salary for the year, or in the case of Mr. Moghadam, based on $1,000,000. Percentages are rounded. |
Our corporate score equals |
| (3) | Effective April 1, 2022, Thomas Olinger stepped down as our chief financial officer and Timothy Arndt became our chief financial officer. Mr. |
| (4) | Amounts paid were rounded to the |
|
|
2020 Compensation Decisions: Core Compensation: Annual LTI Equity Awards
Annual LTI equity awards are 100% based on performance and not guaranteed.
HOW IT WORKSguaranteed
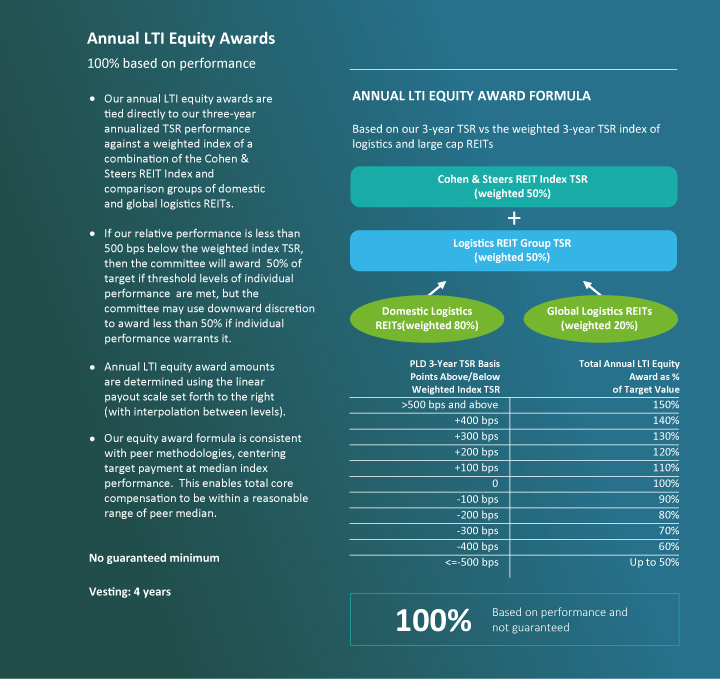
|
|
Annual LTI equity award benchmarks are a balance of logistics and large cap REITs.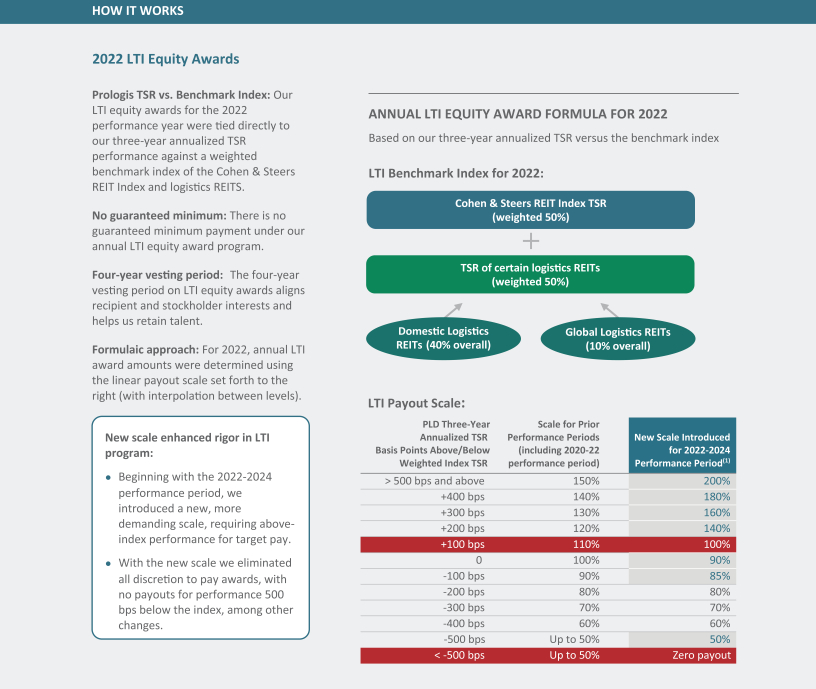
| (1) |
|
|
|
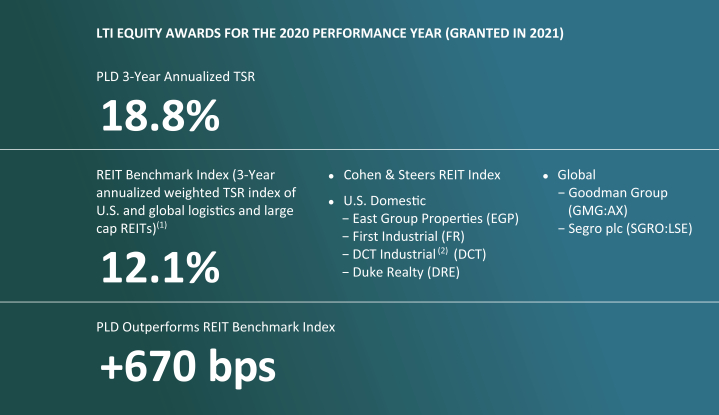
|
|
|
|
LTI equity benchmark index to be refined beginning with 2022-2024 performance period
Current LTI Benchmark Index: For performance periods up to the 2021-2023 period, we utilized an LTI equity award benchmark index comprised 50% of the Cohen & Steers REIT Index and 50% of a logistics REITs, which included 40% domestic (U.S.) logistics REITs and 10% global logistics REITs.
Future LTI Benchmark Index: Beginning with the 2024 performance year (LTI equity awards granted in respect of the 2022-2024 performance period), the LTI equity award benchmark index will be comprised 100% of the Cohen & Steers REIT Index. The Cohen & Steers REIT Index is a performance benchmark that includes approximately 30 large-cap REITs and is important to our stockholders to evaluate our performance against other large-cap REITs. The Committee made this change effective with the 2022-2024 performance period to align with the changes to the LTI scale that the Committee made in the last proxy cycle.
| · | Very few logistics REITs and |
| · | In 2022, we acquired Duke Realty Corporation, a logistics REIT that was previously included in the benchmark. Similarly, in 2018 we acquired DCT Industrial Trust, another logistics REIT that was previously used in the benchmark. |
| · | Transitioning to the Cohen & Steers REIT Index exclusively also mitigates the volatility of the smaller logistics REITs and prevents any one smaller logistics REIT’s performance from having overriding influence on our LTI awards. |
| · | During the course of investor outreach, we discussed this change with a number of our stockholders. None expressed any concern over implementing this new benchmark index. We also tested this change to the formula and determined that the change would not result in a higher payout based on 2022 performance. |
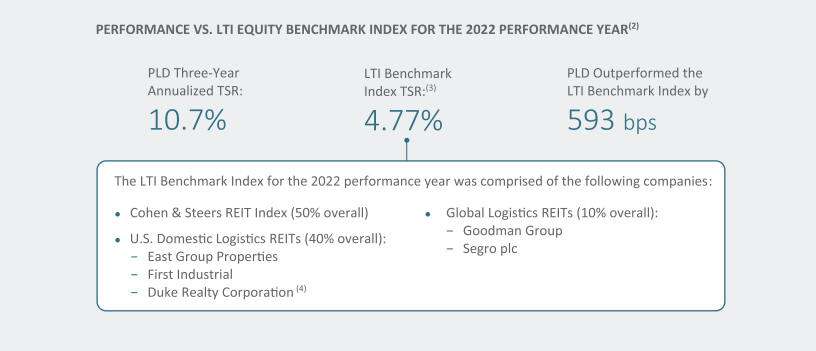
| (1) | AUMs derived from publicly available data as of December 31, 2022. Prologis AUM includes estimated investment capacity. |
| (2) | For awards granted in 2023. |
| (3) | Three-year annualized weighted TSR index of U.S. and global logistics and large cap REITs. The weighted annualized three-year TSR for the Cohen & Steers Realty Majors Portfolio Index (RMP) (the Cohen & Steers REIT Index) and the global and U.S. logistics REIT comparison groups were 0.6%, 4.2% and 10.1%, respectively. |
| (4) | We acquired Duke Realty Corporation in 2022. Duke Realty Corporation was included for performance calculations through May 9, 2022, the trading day prior to the date on which Prologis made public its desire to acquire Duke Realty Corporation. |
PROLOGIS PROXY STATEMENT | MARCH 24, 2023 | 69 |
| COMPENSATION DISCUSSION AND ANALYSIS |
LTI EQUITY AWARDSAWARD PAYOUTS FOR THE 20202022 PERFORMANCE YEAR (GRANTED IN 2021)2023)(1)
2022 Actual Award Value
| ||||||||||||||||||||||||
| 2020 Actual Award Value | ||||||||||||||||||||||||
NEO | 2020 Target Award Value | % Target | $ | 2022 Target Award Value | % Target | $ | ||||||||||||||||||
Hamid Moghadam | $ | 8,250,000 |
|
| 150% |
| $ | 12,375,000 |
| $8,250,000 | 150% | $12,375,000 | ||||||||||||
Thomas Olinger | $ | 2,100,000 |
|
| 150% |
| $ | 3,150,000 |
| |||||||||||||||
Timothy Arndt(2) | $1,350,000 | 150% | $2,025,000 | |||||||||||||||||||||
Thomas Olinger(2) | $0 | N/A | $0 | |||||||||||||||||||||
Eugene Reilly | $ | 2,600,000 |
|
| 150% |
| $ | 3,900,000 |
| $2,600,000 | 150% | $3,900,000 | ||||||||||||
Gary Anderson | $2,300,000 | 150% | $3,450,000 | |||||||||||||||||||||
Edward Nekritz | $ | 2,100,000 |
|
| 150% |
| $ | 3,150,000 |
| $2,100,000 | 150% | $3,150,000 | ||||||||||||
Gary Anderson | $ | 2,300,000 |
|
| 150% |
| $ | 3,450,000 |
| |||||||||||||||
Michael Curless | $ | 1,600,000 |
|
| 150% |
| $ | 2,400,000 |
| |||||||||||||||
| (1) | The |
Annual LTI equity awards for the 2019 performance year (granted in 2020)
|
Effective April 1, 2022, Thomas Olinger stepped down as our chief financial officer and Timothy Arndt became our chief financial officer. Mr. Olinger was not granted an LTI equity award in 2023 for the 2022 performance year. |
|
Prior year: annual LTI equity awards for the 2021 performance year (granted in 2022)
Although the Summary Compensation Table presentation requires disclosure of LTI equity awards granted in 2022 to be included in aggregate compensation for 2022, the Committee considers these awards to be compensation for the 2021 performance year. As such, LTI equity awards granted in 2022 are part of the Committee’s assessment of compensation for the 2021 performance year, not the 2022 performance year.
2019-2021 company performance resulted in 1,610 bps outperformance relative to the index of the logistics REIT comparison groups and the Cohen & Steers REIT Index. In accordance with our equity formula, equity awards for the 2021 performance year were paid to all NEOs at 150% of target. See our 2022 annual proxy statement for further detail.
For the 2021 performance year, all NEOs received the same LTI equity award values as their awards for the 2022 performance year (aside from Tim Arndt, who became our chief financial officer effective April 1, 2022, and Mr. Olinger, who stepped down as our chief financial officer effective April 1, 2022).
PROLOGIS PROXY STATEMENT | MARCH 24, 2023 | 70 |
| COMPENSATION DISCUSSION AND ANALYSIS |
Outperformance Compensation
POP and PPP awards require significant outperformance: Our programs allow outperformance earning opportunities only if high-reach hurdles are met, which creates significant value for our stockholders. POP and PPP awards are each only a small fraction of the total associated value created for our stockholders:
| · | We created $22.4 billion of value over the performance of MSCI REIT Index, the measurement index that we use to determine whether POP awards are payable. |
| · |
|
| · | The corresponding POP and PPP awards paid to our CEO were only 0.08% and 1.6% of the value generated for our stockholders in our outperformance programs, respectively.(1) |
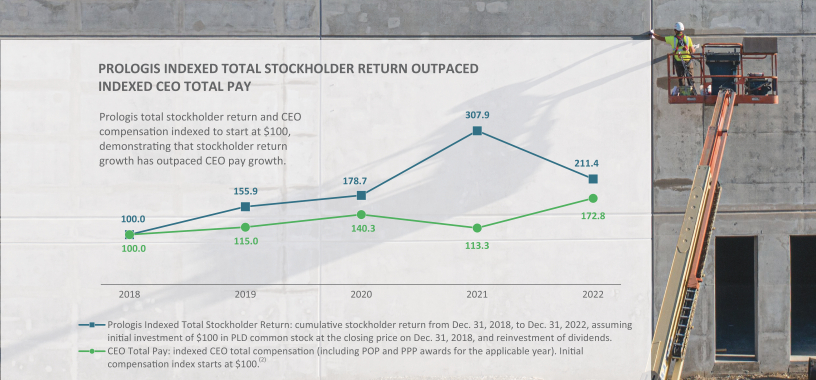
| (1) | See footnotes to pages 58 and 59 for detail about these calculations. |
| (2) | CEO Total Compensation for a performance year |
|
|
2020 Compensation Decisions: Outperformance Plans
|
|
|
|
|
Outperformance Compensation: POP Rewards significant relative TSR outperformance and Optimizes stockholder return: POP extends to about 100 employees, supporting a teamwork mentality deep into our organization that motivates POP participants across the company to drive long-term outperformance. |
HOW IT WORKS

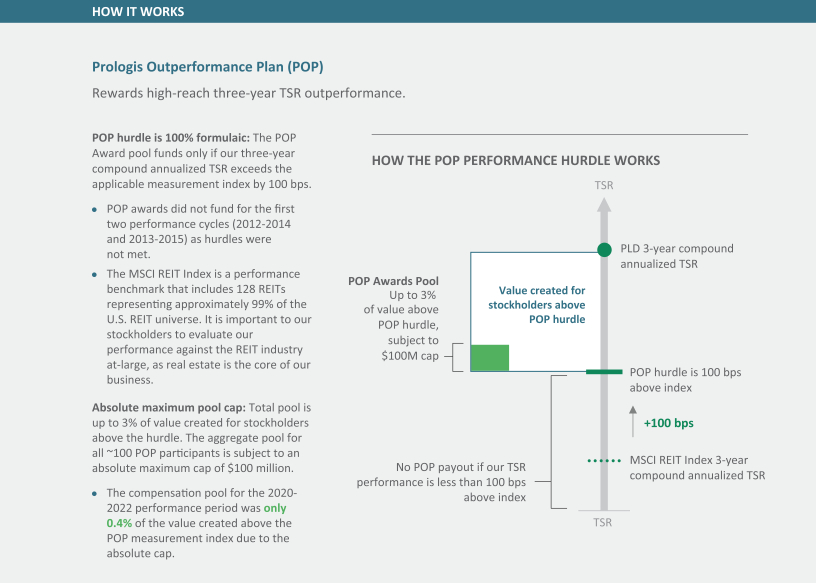
|
|
|
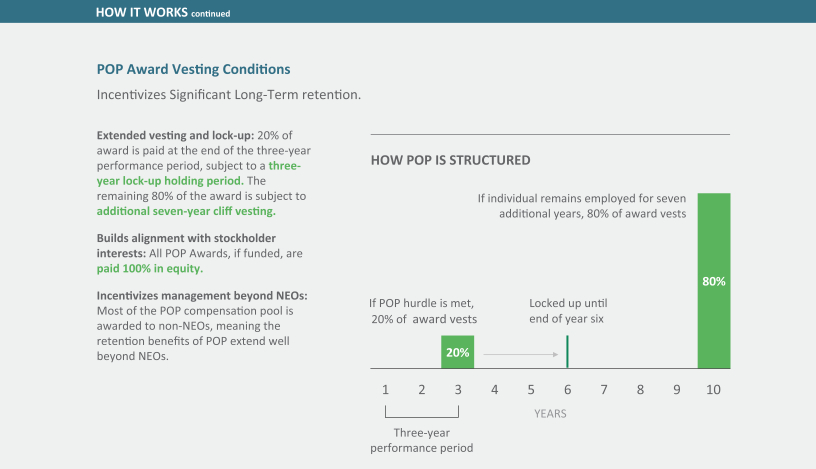
|

POP program enhancements based on stockholder feedback: In response to past stockholder feedback, we:
|
|
| · |
|
|
| · |
|
| · | Although the new vesting construct was effective for performance periods starting in 2018, our then-in-office NEOs demonstrated deep commitment to the company by voluntarily |
Stockholders received 99.6% of the $22.4B in value created above the POP measurement hurdle for the 2020-2022 performance period.
PROLOGIS PROXY STATEMENT | MARCH 24, 2023 | 73 |
| COMPENSATION DISCUSSION AND ANALYSIS |
Compensation Committee Rationale: Why POP Is a Necessary Complement to LTI Equity.
We utilize POP to retain our current NEO team, which supports the continuity necessary to complete the development of our next group of NEOs and positions the company responsibly for a smooth transition.
| · | Continuity of senior leadership, particularly at the NEO level, has been critical to |
| · | The Committee designed POP with succession planning in mind. Retention of long-tenured NEOs has been and will continue to be critical to developing the next generation of leadership, which requires the appropriate runway to properly train potential successors to cover the scope of our global business. |
| · | Similarly, POP helps us retain our next generation of leaders. We expect future NEOs to come from our current POP participant pool. Prologis prefers to promote from within, given the multifaceted nature of our business and high expectations we place on our employees. POP has been instrumental in securing and retaining leadership talent with the specific skill sets necessary for our business. |
| · | We run our business leanly and efficiently, with only about 2,500 total employees covering $196 billion in real estate AUM. POP’s ten-year construct (three years to earn awards plus seven-year vesting on 80% of each award) is a powerful long-term retention mechanism for our senior leaders who are key to maintaining such efficiency. |
POP and LTI Equity extend to different employee bands, so they are structured differently.
| · | We view both LTI equity and POP as part of our long-term incentive structure that aligns stockholder and employee interests. In peer benchmarking, the Committee evaluates LTI and POP in combination as the long-term equity element of our compensation program. While categorized together in this respect, we structured LTI and POP differently to reflect the different employee bands that participate in the programs. |
| · | POP targets about 100 of our top senior leaders who pose the highest talent risk from a business growth and continuity as well as a talent development standpoint. The Committee has evaluated the other financial opportunities available to our senior leaders in the marketplace and concluded that a POP-style element is necessary to maintain the competitiveness of our overall compensation package for this employee band. |
| · | POP still remains true to the Committee’s pay-for-performance discipline with its purely formulaic relative three-year TSR outperformance hurdle. |
| · | POP is all or nothing. POP only pays out when high-reach performance hurdles are hit and no amount is paid if the performance hurdle is not met. Employees who are eligible for POP have greater pay opportunities, but with higher risk given the all-or-nothing payout as well as the seven-year vesting period on the bulk of awards. |
| – | To illustrate, if the 2022-2024 performance period had ended on December 31, 2022, we would not have achieved the applicable performance hurdle and no POP awards would have been made to any POP participant (neither NEOs nor any other participant) for that period. |
| · | In contrast, LTI awards are built on a sliding scale because annual LTI awards extend to a broader employee population than POP. Our LTI equity program ensures a more stable compensation level for this band of employees while still incorporating the retentive benefit of four-year vesting. |
| · | In the course of our investor outreach, some stockholders questioned why we would pay LTI awards if our three-year TSR underperforms against the benchmark index. It would cause undue talent risk in the broader LTI employee band to pay nothing in the event of underperformance. The LTI equity formula ensures market compensation in such a circumstance: we pay below-target compensation for below-target performance to a certain level (500 bps underperformance), below which no LTI equity awards will be paid. |
| · | LTI equity awards are designed to be the largest portion of our NEOs’ Core Compensation, |
|
|
HOW IT WORKS

Outperformance Compensation: PPP
PELF Promote was conditioned on the achievement of a rigorous performance hurdle:
PELF is a critical Strategic Capital vehicle:
Compensation Committee Rationale: Strategic Capital Creates Long-Term Value. PPP Should Be Analyzed Over the Long-Term. PPP awards are highly variable: PPP awards are paid only when Strategic Capital outperformance results in Promotes paid to the company. As a result, PPP award timing and amounts are highly variable depending on Promote calculation timing and the size of the applicable vehicle. The value of Promotes earned by Prologis in any given year, and thus the amount of PPP awards, depends on the availability of Promote earning opportunities and the cadence of performance periods across our Strategic Capital vehicles (as well as whether we achieve the performance hurdle). Averaging PPP awards over a trailing three-year period accounts for this variability and provides a long-term view of not only the actual size of PPP, but also the value Strategic Capital Promotes bring to our stockholders over time. Our largest vehicles are open-ended, meaning they accept an uncapped flow of new investment capital. These vehicles therefore have the potential to create significant long-term value for our stockholders in the form of substantial Promote earnings from an open-ended pool. The chart below also illustrates the growth in our Strategic Capital AUM, a testament to how PPP has successfully underpinned the growth of our Strategic Capital business over time. The Committee’s view on future Promote potential: Looking forward, Promote revenue (and associated PPP awards) could potentially be substantial again in 2023 given that one of our largest Strategic Capital vehicles, Prologis Targeted U.S. Logistics Fund (USLF), has a Promote earning opportunity in 2023. However, the Committee anticipates a significant decline in Promote earnings (and PPP awards) in 2024 and over the following several years. There are no major Promote calculation opportunities scheduled in 2024. Also, a number of vehicles have high-water marks built into their Promote hurdles, which require higher levels of outperformance than previously achieved for Promotes to be paid. The Committee expects it will be challenging for certain Strategic Capital vehicles, particularly those that have significantly outperformed in recent years, to achieve Promote return hurdles beyond applicable high-water marks within the next performance period.
The company has taken actions to reduce the variability of future Promote earning opportunities: We have restructured Promotes for PELF, USLF and Prologis China Core Logistics Fund (our three largest private, open-ended vehicles) such that for all new third-party investments in these vehicles made after specified times, the three-year Promote measurement period will commence on the date on which the new investment in the vehicle is made. In the past, all investments in the vehicle were tied to the same Promote measurement periods. Going forward, new investments in these ventures will have their own Promote measurement periods. The Committee expects this will result in less variability in Promotes (to the extent the company earns them going forward), which will in the long-term reduce dramatic variability in PPP awards.
Other Compensation Elements and Considerations LTIP Units
| |||||||||||||||||||||||||||||||||||||||||||||||||||||||||||||||||||||||||||||||||||||||||||||||||||||||||||||||||||||||||||||||||||||||||||||||||||||||||||||||||||||||||||||||||||||||||||||||||||||||||||||||||||||||||||||||||||||||||||||||||||||||||||||||||||||||||||||||||||||||||||||||||||||||||||||||||||||||||||||||||||||||||||||||||||||||||||||||||||||||||||||||||||||||||||||||||||||||||||||||||||||||||||||||||||||||||||||||||||||||||||||||||||||||||||||||||||||||||||||||||||||||||||||||||||||||||||||||||||||||||||||||||||||||||||||||||||||||||||||||||||||||||||||||||||||||||||||||||||||||||||||||||||||||||||||||||||||||||||||||||||||||||||||||||||||||||||||||||||||||||||||||||||||||||||||||||||||||||||||||||||||||||||||||||||||||||||||||||||||||||||||||||||||||||||||||||||||||||||||||||||||||||||||||||||||||||||||||||||||||||||||||||||||||||||||||||||||||||||||||||||||||||||||||||||||||||||||||||||||||||||||||||||||||||||||||||||||||||||||||||||||||||||||||||||||||||||||||||||||||
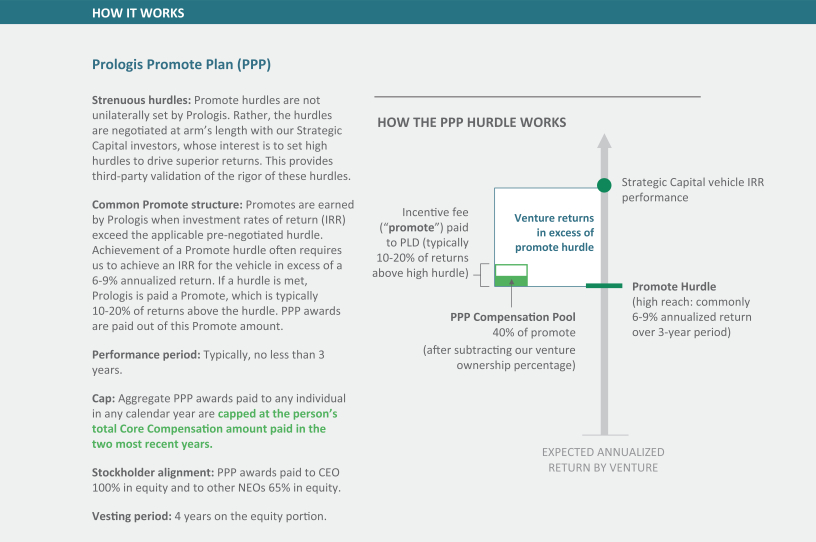
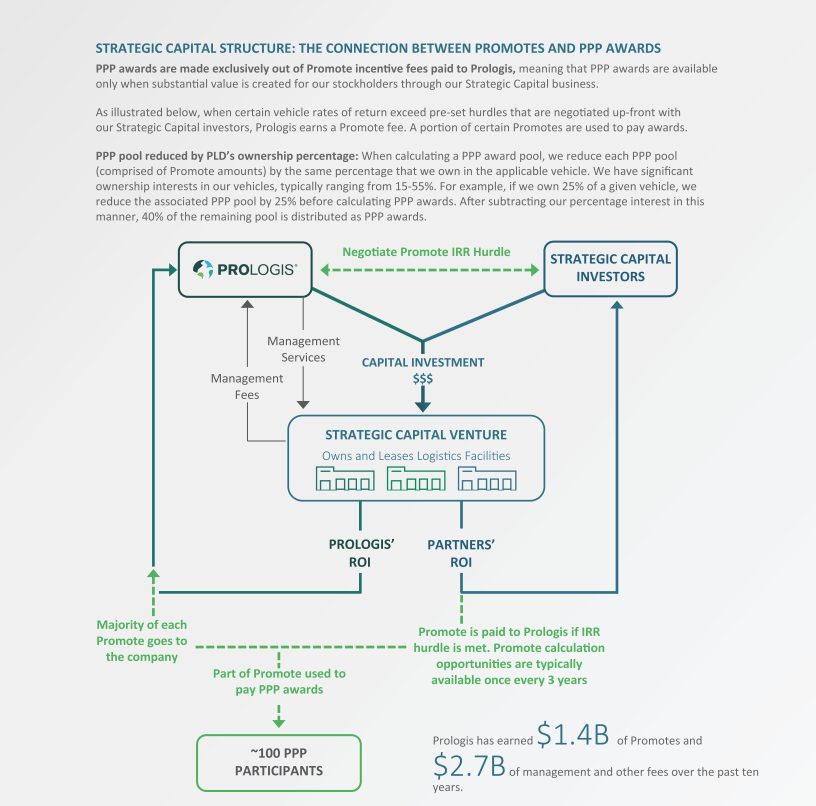

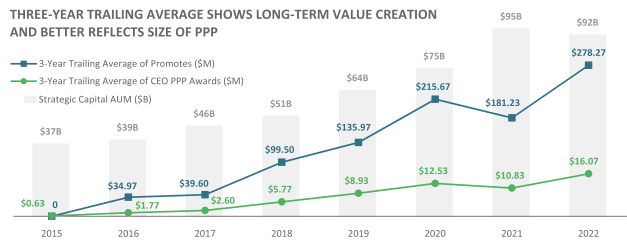
 100% of CEO pay is at-risk and not guaranteed
 No guaranteed salary / bonus increases